Fig. 10
Download original image
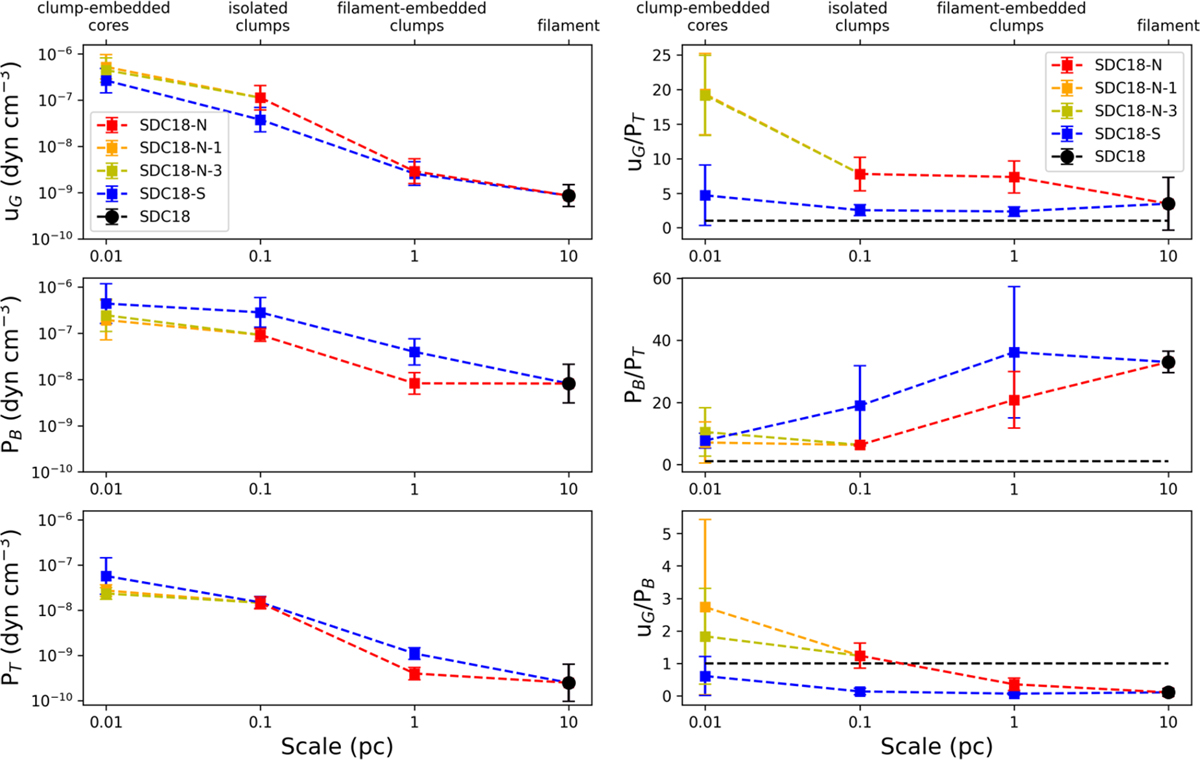
Left panels: uG, PB, and PT as a function of scale on which they are estimated for SDC18-N (red), SDC18-N-1 (orange), SDC18-N-3 (yellow), SDC18-S (blue), and the SDC18 filament (black). Right panels: Ratios of the three quantities uG, PB, and PT as a function of scale. Black dashed lines mark the loci where the ratios are unity, indicating equal contributions of two agents among gravity, magnetic field, and turbulence. We note that the indicated scales on the horizontal axes are assigned numbers. They are meant to represent the scales for the defined boundaries over which the energies are calculated. Error bars indicate 1σ errors propagated through the equations with uncertainties, as described in Section 4.2.
Current usage metrics show cumulative count of Article Views (full-text article views including HTML views, PDF and ePub downloads, according to the available data) and Abstracts Views on Vision4Press platform.
Data correspond to usage on the plateform after 2015. The current usage metrics is available 48-96 hours after online publication and is updated daily on week days.
Initial download of the metrics may take a while.