Fig. 1
Download original image
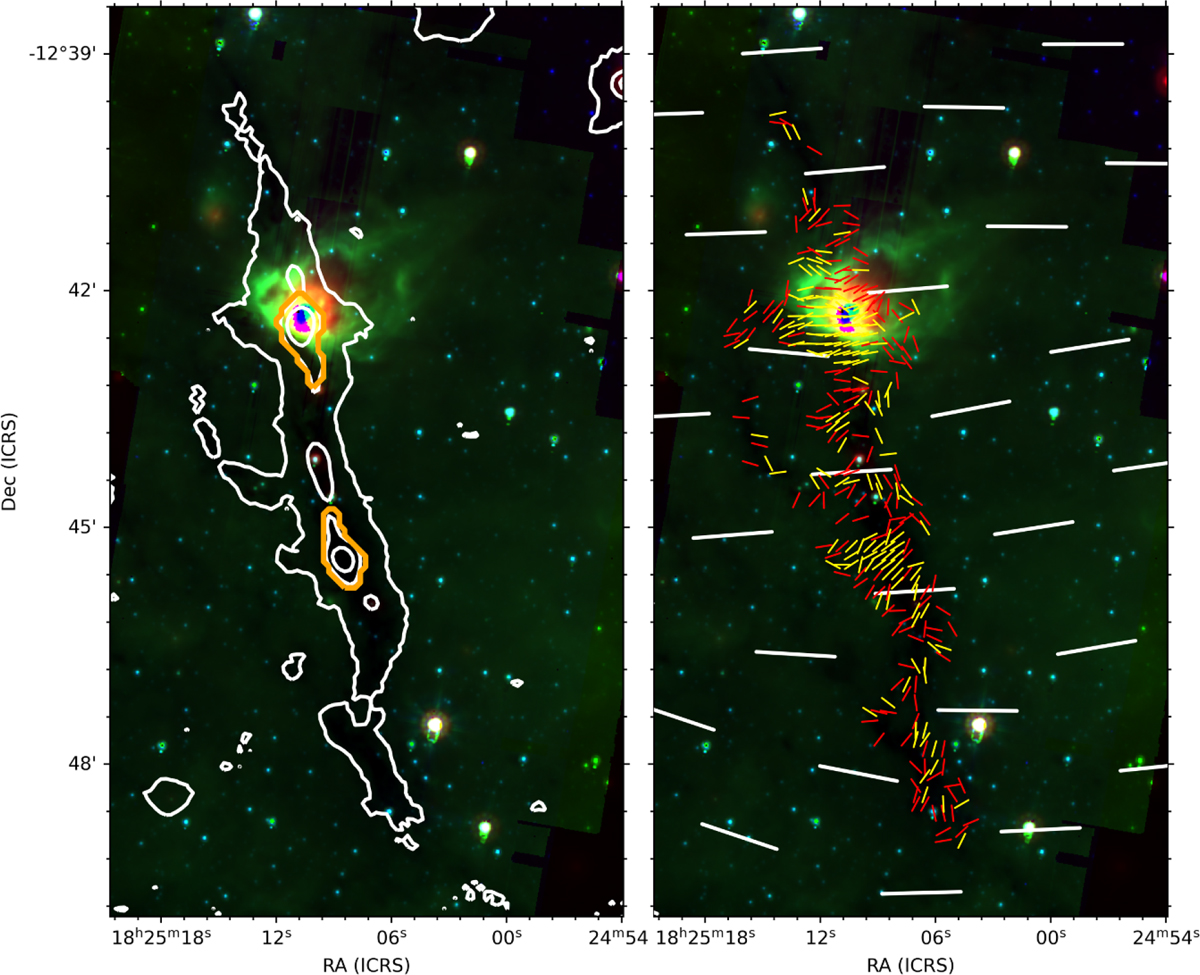
Spitzer images of SDC18 at 24 μm (red), 8 μm (green), and 5.8 μm (blue), together with JCMT/POL-2 850μm dust continuum contours (left panel) and magnetic field structures (right panel). The contours denote the 50, 500, and 1000 mJy beam−1 of the JCMT total intensity. Orange contours are the boundaries of SDC18-N and SDC18-S at filament-embedded clump scale determined by the dendrogram analysis. The JCMT/POL-2 magnetic field orientations with P> 3σP are in yellow and in red for 3σP > P > 2σP. White segments are the larger-scale Planck magnetic field orientations inferred from 90° rotation of polarization at 353 GHz (∼ 5ʹ) in a pixel size of 103ʺ.
Current usage metrics show cumulative count of Article Views (full-text article views including HTML views, PDF and ePub downloads, according to the available data) and Abstracts Views on Vision4Press platform.
Data correspond to usage on the plateform after 2015. The current usage metrics is available 48-96 hours after online publication and is updated daily on week days.
Initial download of the metrics may take a while.