Open Access
Fig. 4
Download original image
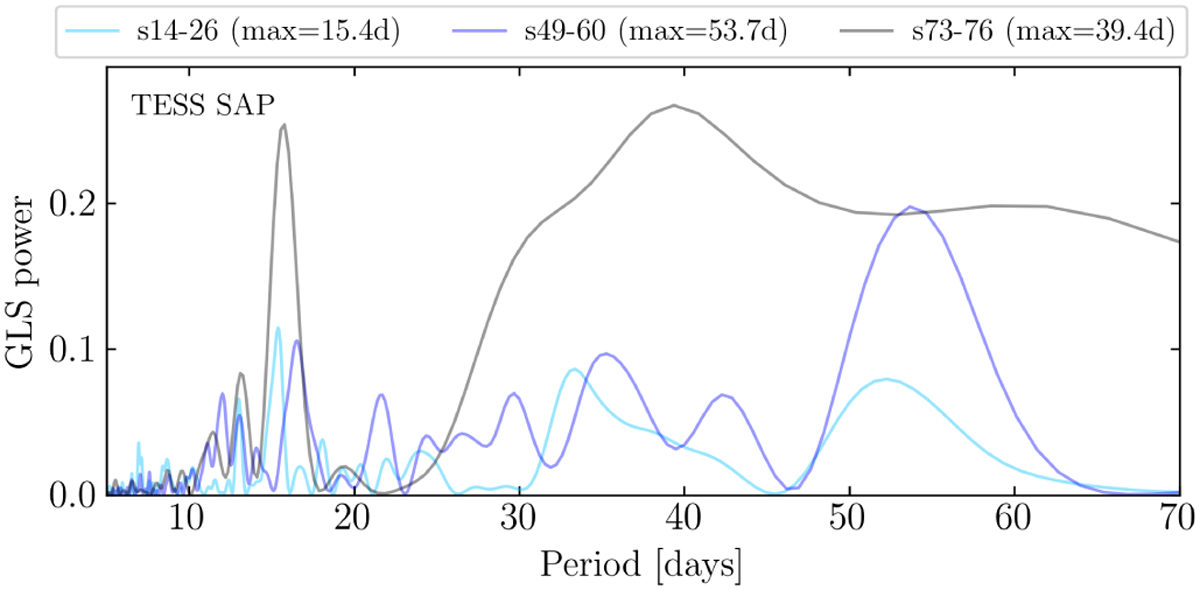
GLS periodograms of the TESS SAP photometry separated into three datasets: sectors 14 to 26 (light blue), sectors 49 to 60 (dark blue), and sectors 73 to 76 (gray). In the legend, the periods at which the power is maximum are indicated inside parentheses for each dataset.
Current usage metrics show cumulative count of Article Views (full-text article views including HTML views, PDF and ePub downloads, according to the available data) and Abstracts Views on Vision4Press platform.
Data correspond to usage on the plateform after 2015. The current usage metrics is available 48-96 hours after online publication and is updated daily on week days.
Initial download of the metrics may take a while.