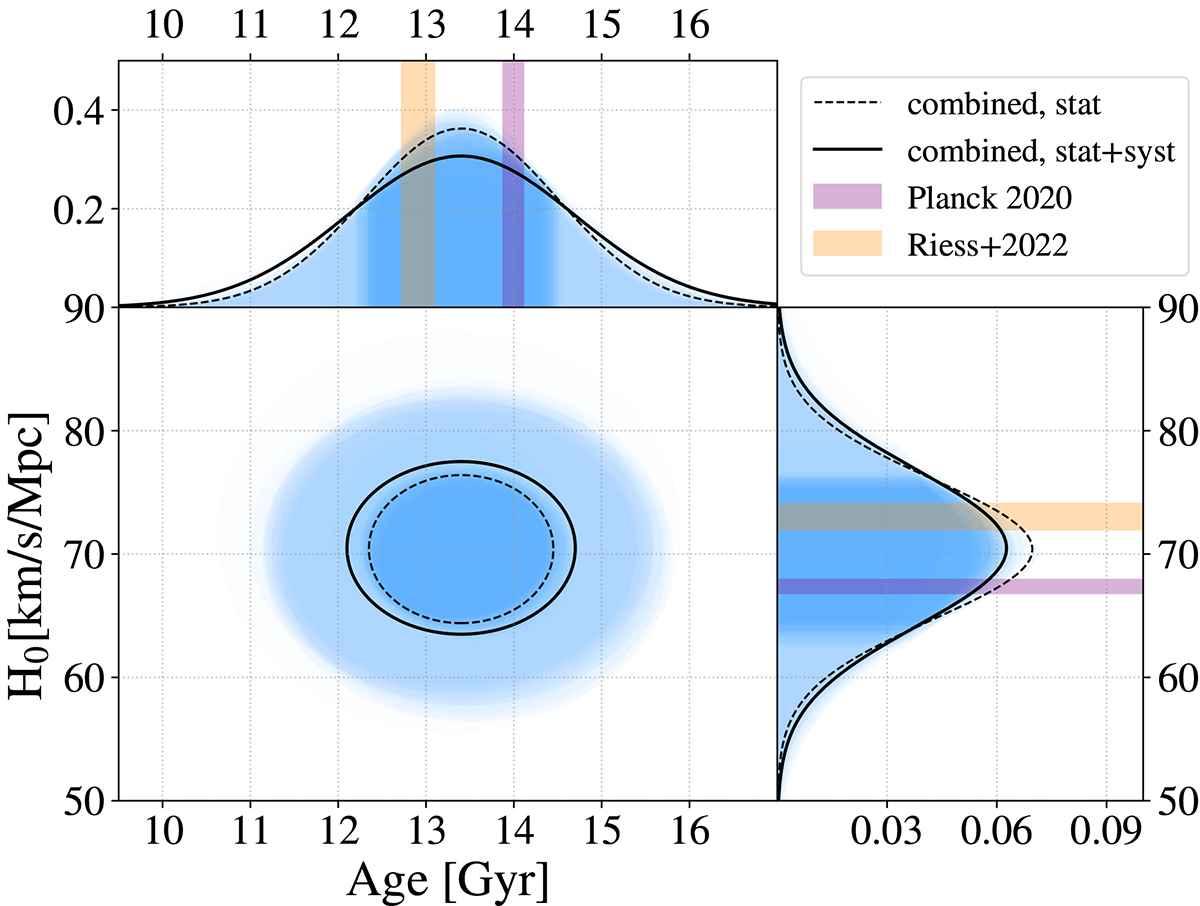
Fig. 9.
Download original image
H0 versus age for the sample of 24 old GCs. The ages and corresponding H0 estimates are shown as Gaussians peaked on the best-fit values and 1-σ equal to the relative uncertainties. The 1-σ limits are also highlighted in a darker blue. The solid black curves correspond to the average GC’s age and relative H0 estimate. For comparison, the values from Riess et al. (2022) and Planck Collaboration VI (2020) are represented, respectively, with dashed and dotted lines in the H0 domain, and in the age-domain we report the corresponding ages of the Universe as computed in a flat ΛCDM with ΩM = 0.3 and ΩΛ = 0.7.
Current usage metrics show cumulative count of Article Views (full-text article views including HTML views, PDF and ePub downloads, according to the available data) and Abstracts Views on Vision4Press platform.
Data correspond to usage on the plateform after 2015. The current usage metrics is available 48-96 hours after online publication and is updated daily on week days.
Initial download of the metrics may take a while.