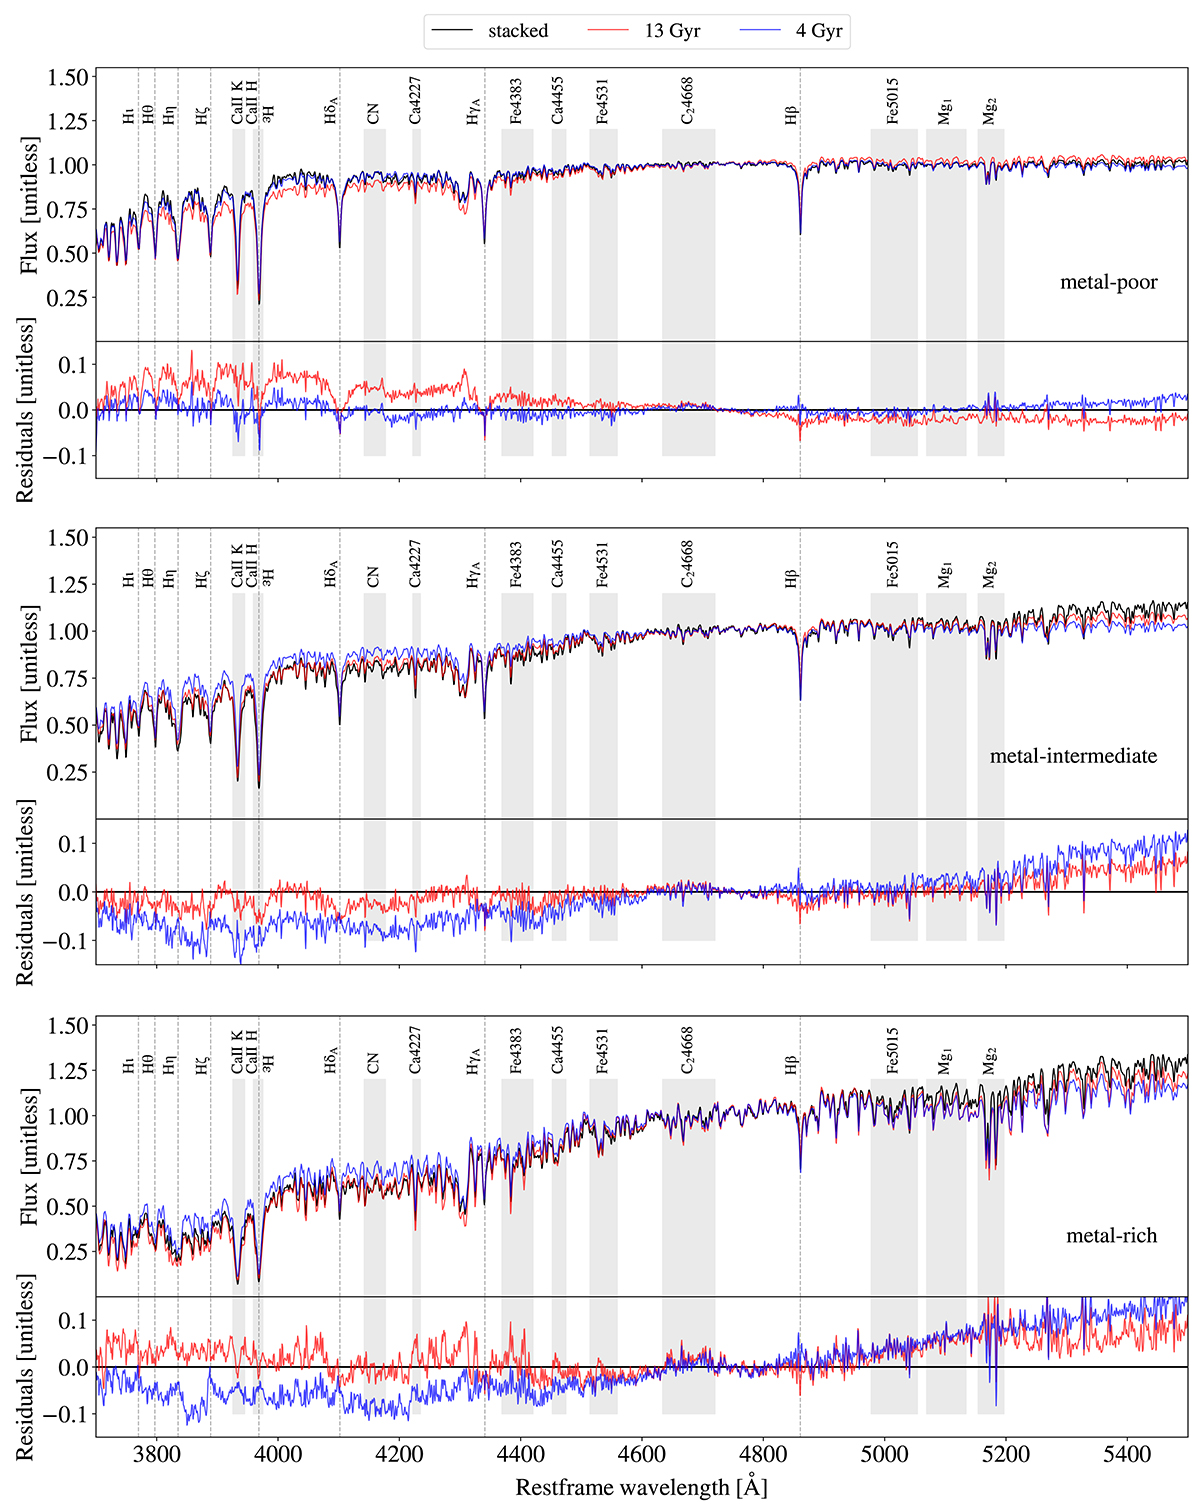
Fig. 7.
Download original image
Stacked spectra of the metal-poor (top panel, [ − 2.2, −1.4]), metal-intermediate (central panel, [ − 1.4, −0.6]) and metal-rich (bottom panel, [ − 0.6, 0.2]) subsamples, in comparison with a 4 Gyr (in blue) and 13 Gyr old (in red) synthetic spectra. The values of mass, dust absorption and velocity dispersion of the synthetic spectra are set to the median literature values of each subgroup. All the spectra are normalised in the window 4500–5000 Å. At the bottom of each panel the residuals of the stacked spectra with respect to the synthetic ones are shown with corresponding colours. The Balmer series is indicated with dashed lines, other relevant spectral features are highlighted with grey boxes. It can be noticed how the different sub-groups show different continuum and spectral features properties, and how the models are able to reproduce more accurately the high-metallicity ones.
Current usage metrics show cumulative count of Article Views (full-text article views including HTML views, PDF and ePub downloads, according to the available data) and Abstracts Views on Vision4Press platform.
Data correspond to usage on the plateform after 2015. The current usage metrics is available 48-96 hours after online publication and is updated daily on week days.
Initial download of the metrics may take a while.