Fig. 4.
Download original image
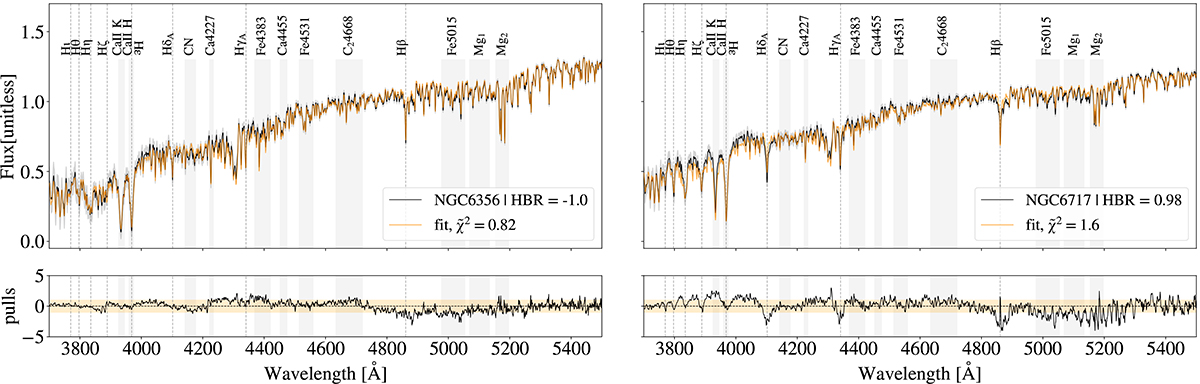
Examples of good fits. In the top panels, the observed spectra are shown in black and the posterior ones in orange. Dashed lines identify the Balmer absorption series, while other main absorption features are highlighted with shaded grey boxes. In the bottom panels, the pulls of each fit ((observed – fit)/error) are shown, with the orange horizontal area representing a 1-σ fluctuation.
Current usage metrics show cumulative count of Article Views (full-text article views including HTML views, PDF and ePub downloads, according to the available data) and Abstracts Views on Vision4Press platform.
Data correspond to usage on the plateform after 2015. The current usage metrics is available 48-96 hours after online publication and is updated daily on week days.
Initial download of the metrics may take a while.