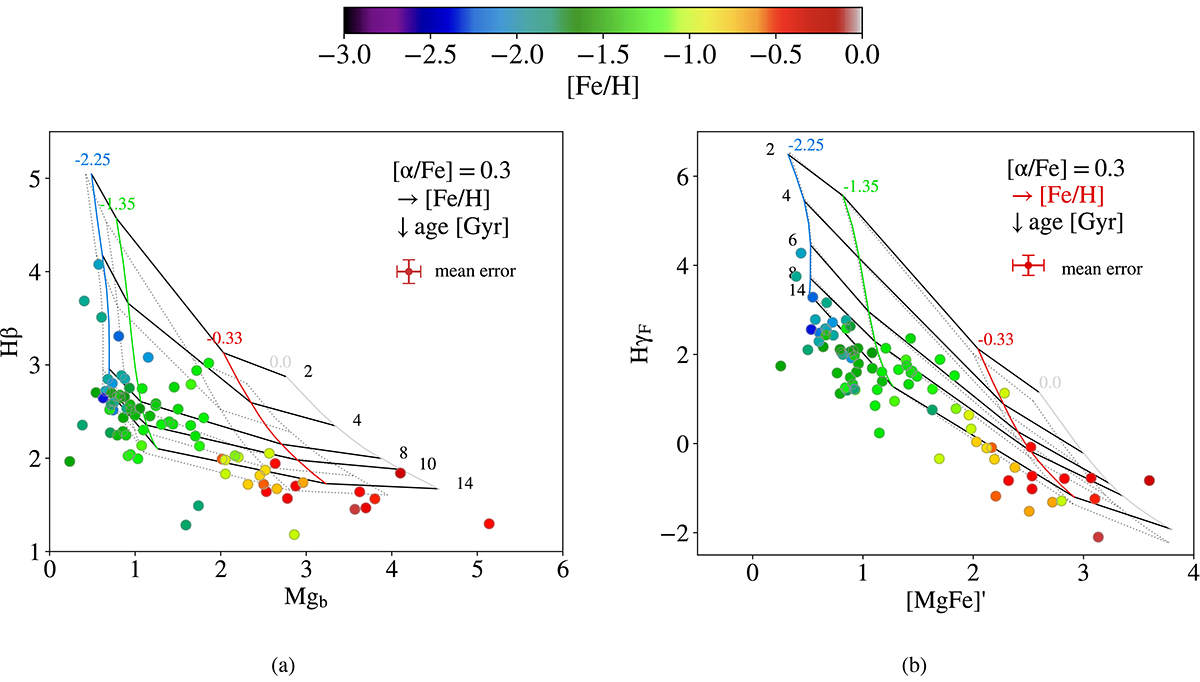
Fig. 2.

Download original image
Index–index diagnostic diagrams, on the left Hβ − Mgb and on the right HγF–[MgFe]’. The points are colour-coded by their literature value of [Fe/H]. We report TMJ models as a grid with varying metallicity (vertical lines) and varying age (horizontal lines), the first with the same colour code as the data points. Solid lines refer to models with [α/Fe] = 0.3, while the dashed lines in the background represent the solar-scaled grid.
Current usage metrics show cumulative count of Article Views (full-text article views including HTML views, PDF and ePub downloads, according to the available data) and Abstracts Views on Vision4Press platform.
Data correspond to usage on the plateform after 2015. The current usage metrics is available 48-96 hours after online publication and is updated daily on week days.
Initial download of the metrics may take a while.


