Fig. 5
Download original image
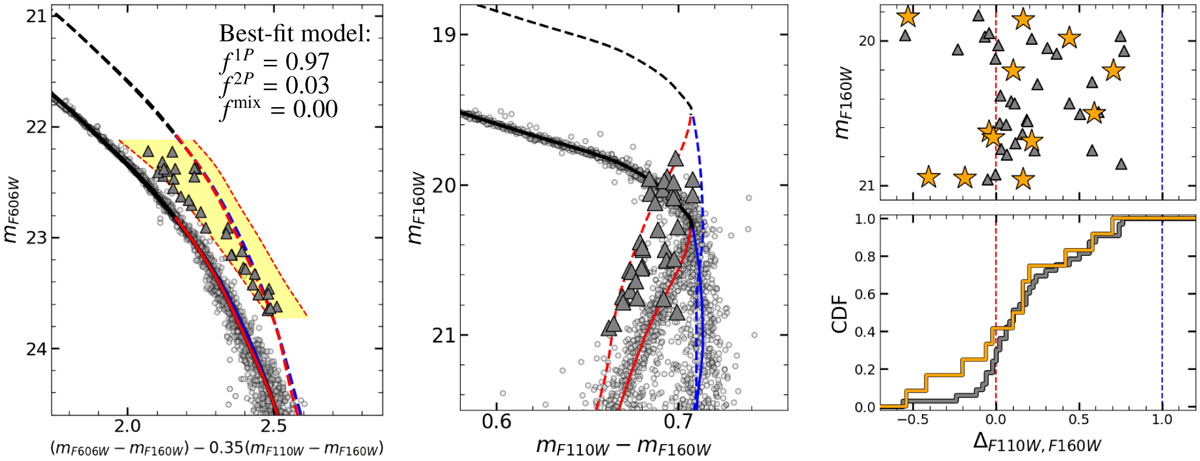
Left: simulated diagrams assuming the best-fit values for the fractions of 1P, 2P, and mixed binaries (same layout as Fig. 4). Gray triangles represent artificial binaries within the yellow region, as defined in Section 4. Middle: mF160W vs. mF110W − mF160W CMD, showing the artificial binaries selected in the left-panel diagram. Right: artificial binaries compared with the selected observed binaries, displayed as in Fig. 4.
Current usage metrics show cumulative count of Article Views (full-text article views including HTML views, PDF and ePub downloads, according to the available data) and Abstracts Views on Vision4Press platform.
Data correspond to usage on the plateform after 2015. The current usage metrics is available 48-96 hours after online publication and is updated daily on week days.
Initial download of the metrics may take a while.