Fig. 4
Download original image
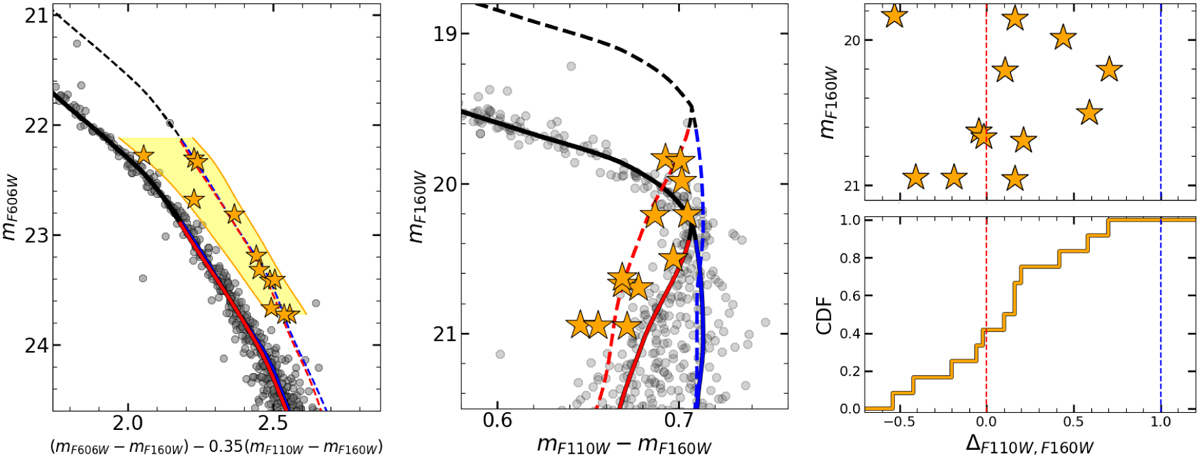
Procedure for selecting and characterizing the binaries used to infer the incidence of 1P and 2P binaries. Left: zoomed-in view of the mF606W vs. (mF606W − mF160W)−0.35(mF110W− mF160W) diagram at the bottom of the MS. Middle: mF160W vs. mF110W−mF160W CMD. Right: verticalized mF160W vs. ΔF110W, F160W diagram (top) and the ΔF110W, F160W cumulative distribution (bottom) for the probable binaries. The probable binaries, which are represented with stars, are selected from the left-panel diagram, where they lie within the yellow-shaded area of the CMD. The solid red and blue lines are the fiducials of 1P and 2P stars, and the dotted lines mark the corresponding loci of equal-mass binaries. See the text for details.
Current usage metrics show cumulative count of Article Views (full-text article views including HTML views, PDF and ePub downloads, according to the available data) and Abstracts Views on Vision4Press platform.
Data correspond to usage on the plateform after 2015. The current usage metrics is available 48-96 hours after online publication and is updated daily on week days.
Initial download of the metrics may take a while.