Fig. 11
Download original image
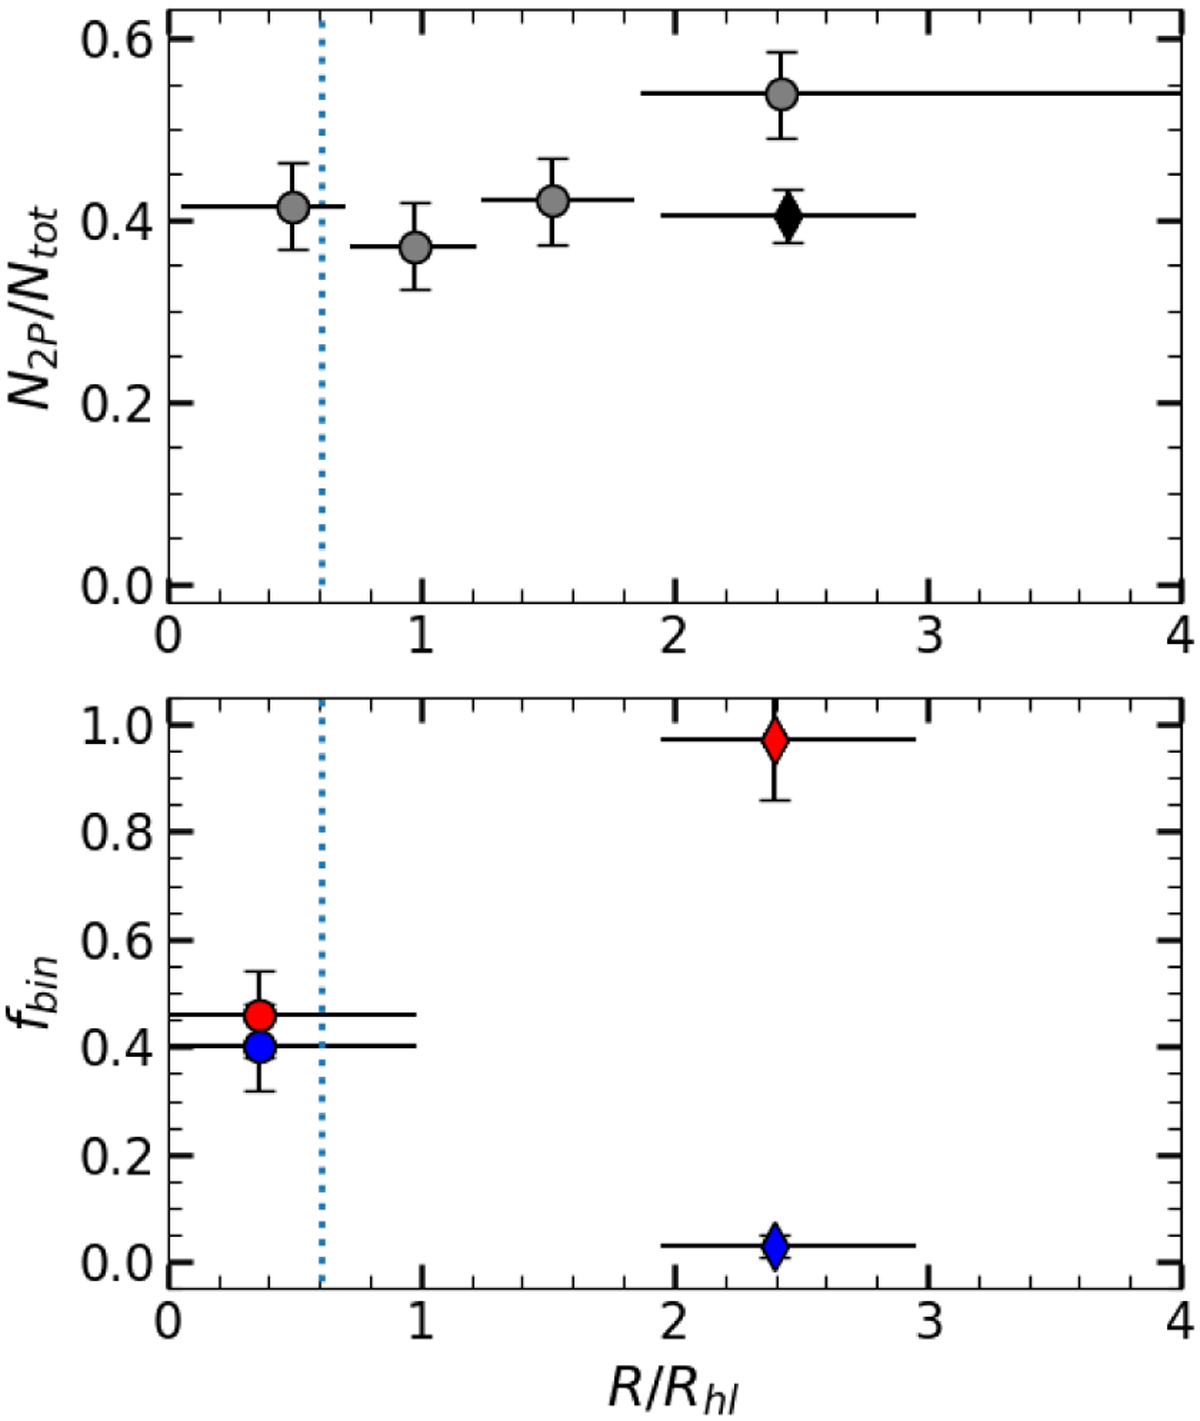
Top: fraction of 2P stars as a function of the radial distance from the cluster center. Gray circles are measurements from Jang et al. (2022), and black diamond from this research. Horizontal and vertical black lines represent the radial coverage of each data point and the corresponding error bars, respectively. Bottom: fraction of 1P and 2P binaries with respect to the total number of binaries, fbin, as a function of the radial distance from the cluster center. Circle markers are measurements from Milone et al. (2020), and diamond markers from the present work. Red and blue refer to 1P and 2P binary fractions, respectively.
Current usage metrics show cumulative count of Article Views (full-text article views including HTML views, PDF and ePub downloads, according to the available data) and Abstracts Views on Vision4Press platform.
Data correspond to usage on the plateform after 2015. The current usage metrics is available 48-96 hours after online publication and is updated daily on week days.
Initial download of the metrics may take a while.