Fig. 4.
Download original image
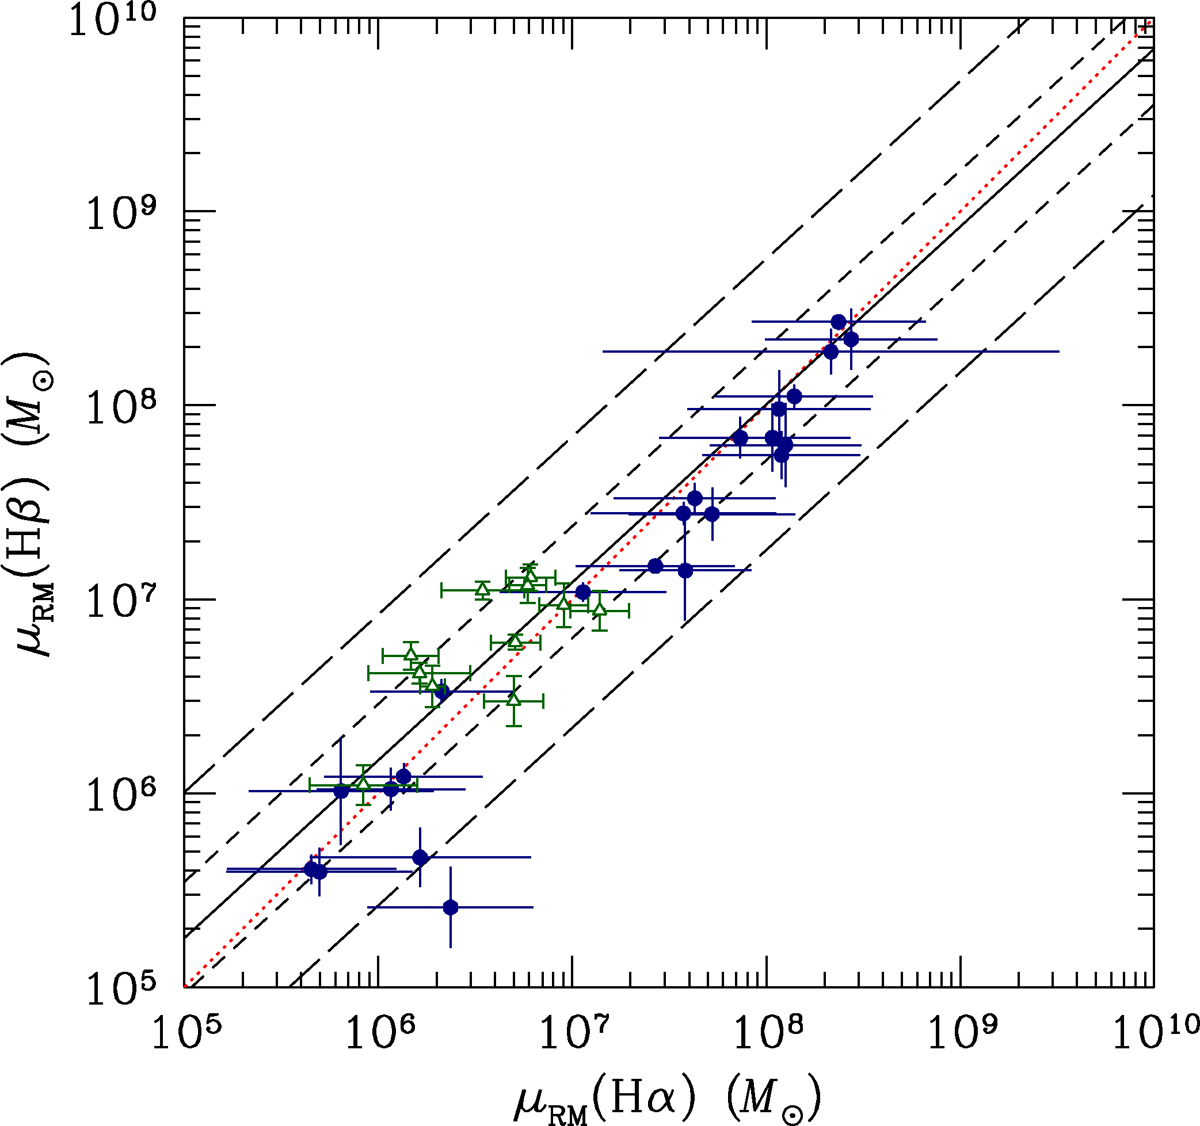
Comparison between virial products based on the Hα data presented in Tables A.1 (blue circles) and B.1 (green triangles) and the virial products based on Hβ in Paper I. The dashed red line shows the locus where the two values are equal. The solid black line shows the best fit to the data. The short- and long-dashed lines show the ±1σ and ±2.6σ envelopes, respectively. The largest outlier is Mrk 202, which Bentz et al. (2010) flag as having an especially dubious Hα lag measurement.
Current usage metrics show cumulative count of Article Views (full-text article views including HTML views, PDF and ePub downloads, according to the available data) and Abstracts Views on Vision4Press platform.
Data correspond to usage on the plateform after 2015. The current usage metrics is available 48-96 hours after online publication and is updated daily on week days.
Initial download of the metrics may take a while.