Fig. 6
Download original image
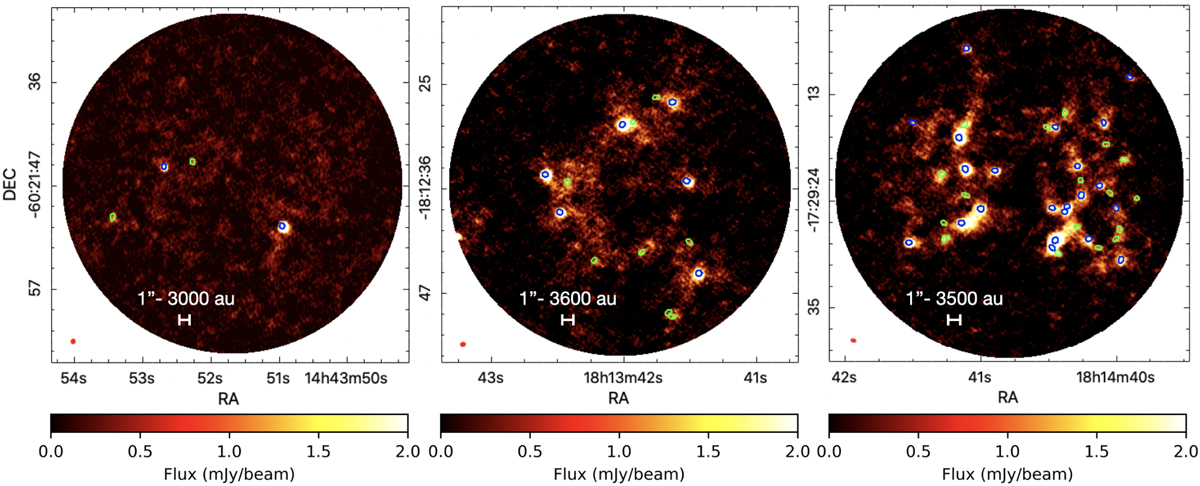
Outcome of the source extraction procedure performed with CuTEx on selected ALMAGAL clumps (from left to right, fields AG316.4045- 0.4657, AG012.4977-0.2233, AG013.2428-0.0854). As in Fig. 5, the blue ellipses mark the compact sources detected at 5 σrms. The three clumps showcase the variety of fragmentation degree, morphologies of structures and patterns of emission revealed across the ALMAGAL sample. The CuTEx algorithm was optimized and tested in order to efficiently perform in all these different conditions. The green ellipses mark the sources that are recovered by allowing a signal-to-noise ratio (S/N) cut of 3 σrms. The map beam is reported in red in the bottom-left corner of each panel.
Current usage metrics show cumulative count of Article Views (full-text article views including HTML views, PDF and ePub downloads, according to the available data) and Abstracts Views on Vision4Press platform.
Data correspond to usage on the plateform after 2015. The current usage metrics is available 48-96 hours after online publication and is updated daily on week days.
Initial download of the metrics may take a while.