Fig. 5
Download original image
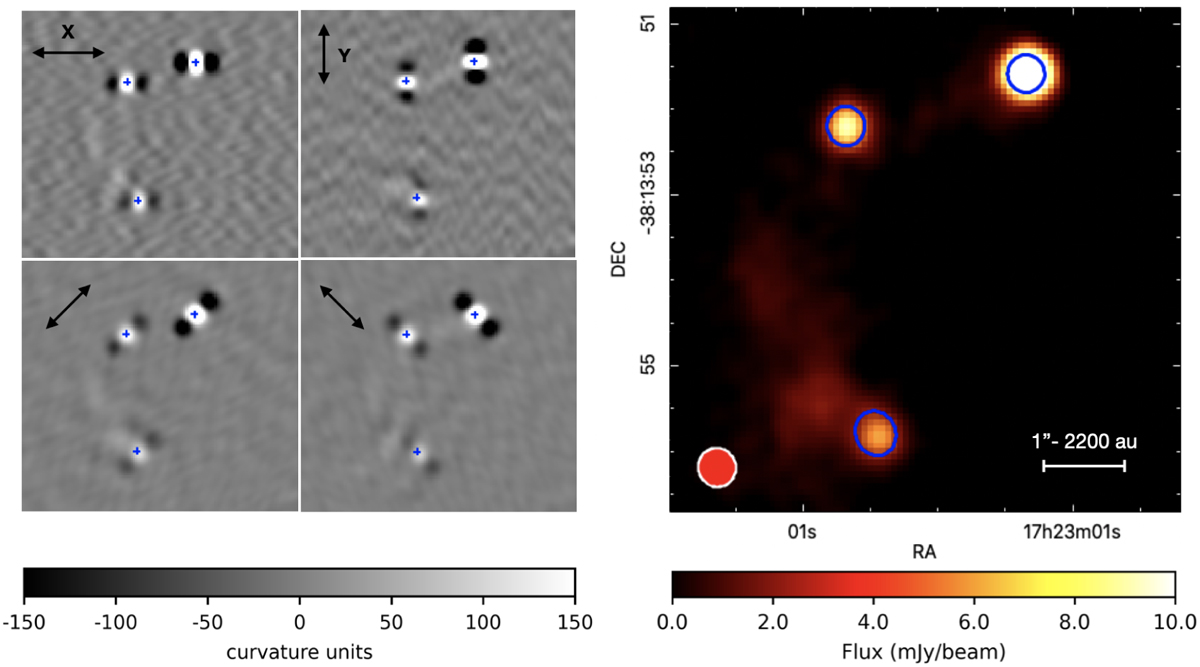
Example of the source extraction procedure performed with CuTEx (see Fig. 4) for the ALMAGAL field AG349.6440-1.0948. Left panel: detection phase performed on curvature images along the reported four different directions; the blue crosses mark the candidate compact sources. Right panel: outcome of the photometry procedure performed on the corresponding intensity image; the blue ellipses represent the estimated shape of the compact sources (in terms of FWHMs and position angle, λPA) as a result of the 2D Gaussian fitting procedure (see Sect. 3.2 for details). Note: the color scale of the image was adjusted to highlight all the three sources at the same time, so their visual appearance in terms of emission extent might not correspond to their actual size (ellipses). The map beam is shown in red in the bottom-left corner of the plot. The angular and physical scales are also reported.
Current usage metrics show cumulative count of Article Views (full-text article views including HTML views, PDF and ePub downloads, according to the available data) and Abstracts Views on Vision4Press platform.
Data correspond to usage on the plateform after 2015. The current usage metrics is available 48-96 hours after online publication and is updated daily on week days.
Initial download of the metrics may take a while.