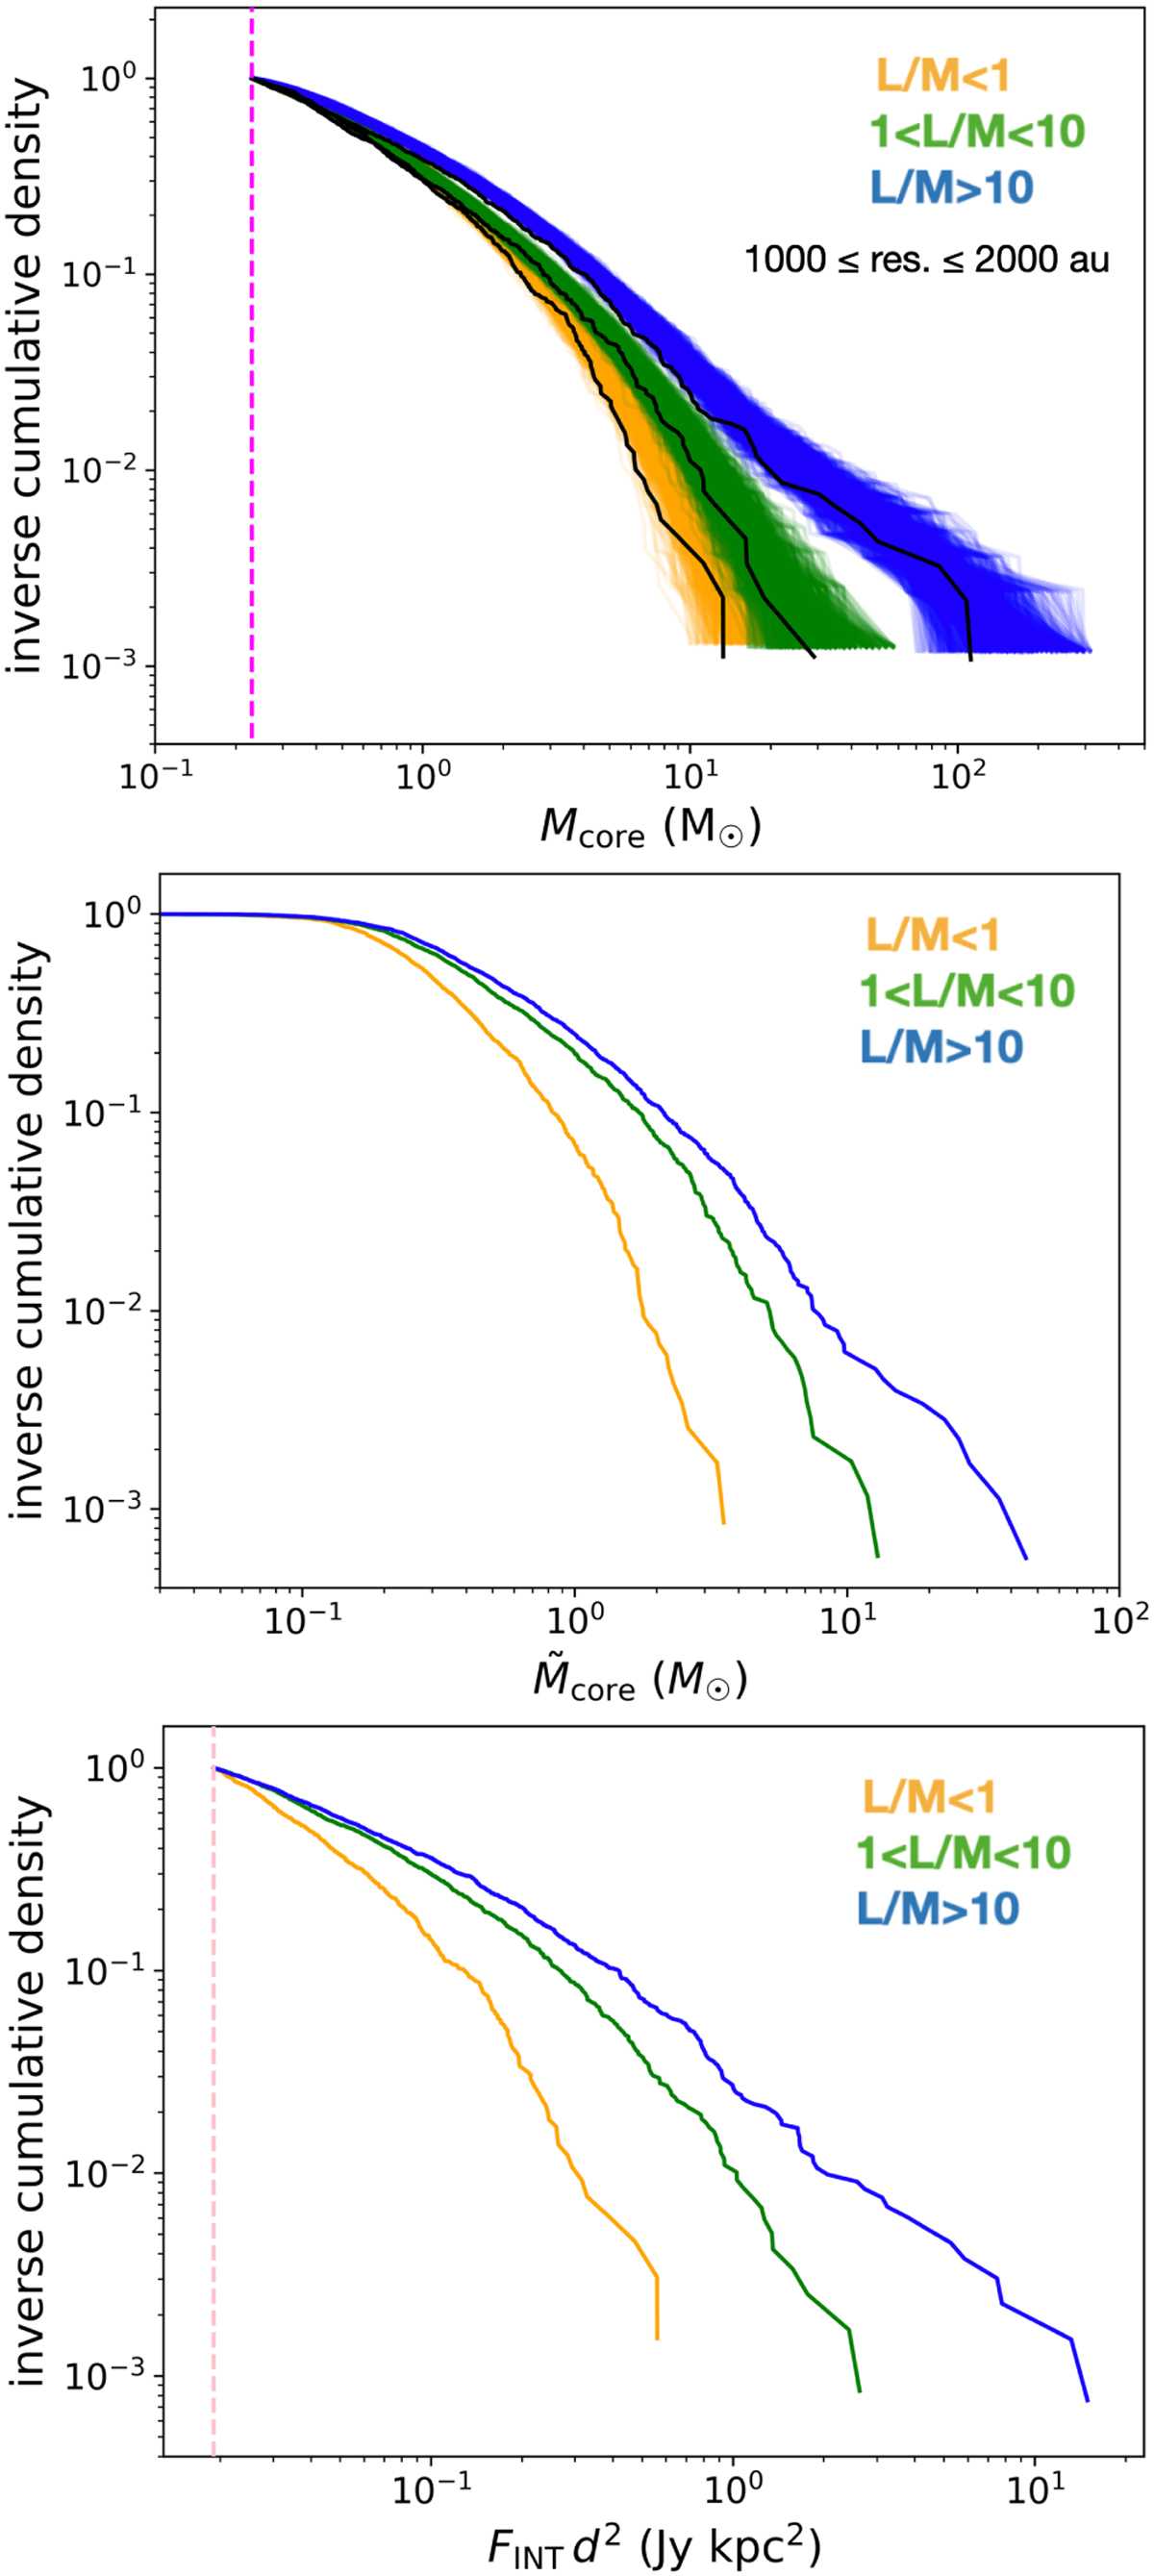
Fig. E.1
Download original image
Analysis conducted to test the result of Fig. 18. Top panel: Same as Fig. 18, but for a subsample of cores selected based on the spatial resolution of the corresponding continuum map (within 1000 – 2000 au). Middle panel: CMF for the three evolutionary groups with core masses obtained using the temperature model from Sadaghiani et al. (2020) (see text for explanation). Bottom panel: Distribution of the FINTd2 quantity for the three evolutionary groups, computed to obtained an analog of the CMF but without the influence of the core temperature assumption. The vertical dashed pink line marks the minimum threshold we imposed for the plotted quantity, calculated by converting our mass completeness limit.
Current usage metrics show cumulative count of Article Views (full-text article views including HTML views, PDF and ePub downloads, according to the available data) and Abstracts Views on Vision4Press platform.
Data correspond to usage on the plateform after 2015. The current usage metrics is available 48-96 hours after online publication and is updated daily on week days.
Initial download of the metrics may take a while.