Fig. D.1
Download original image
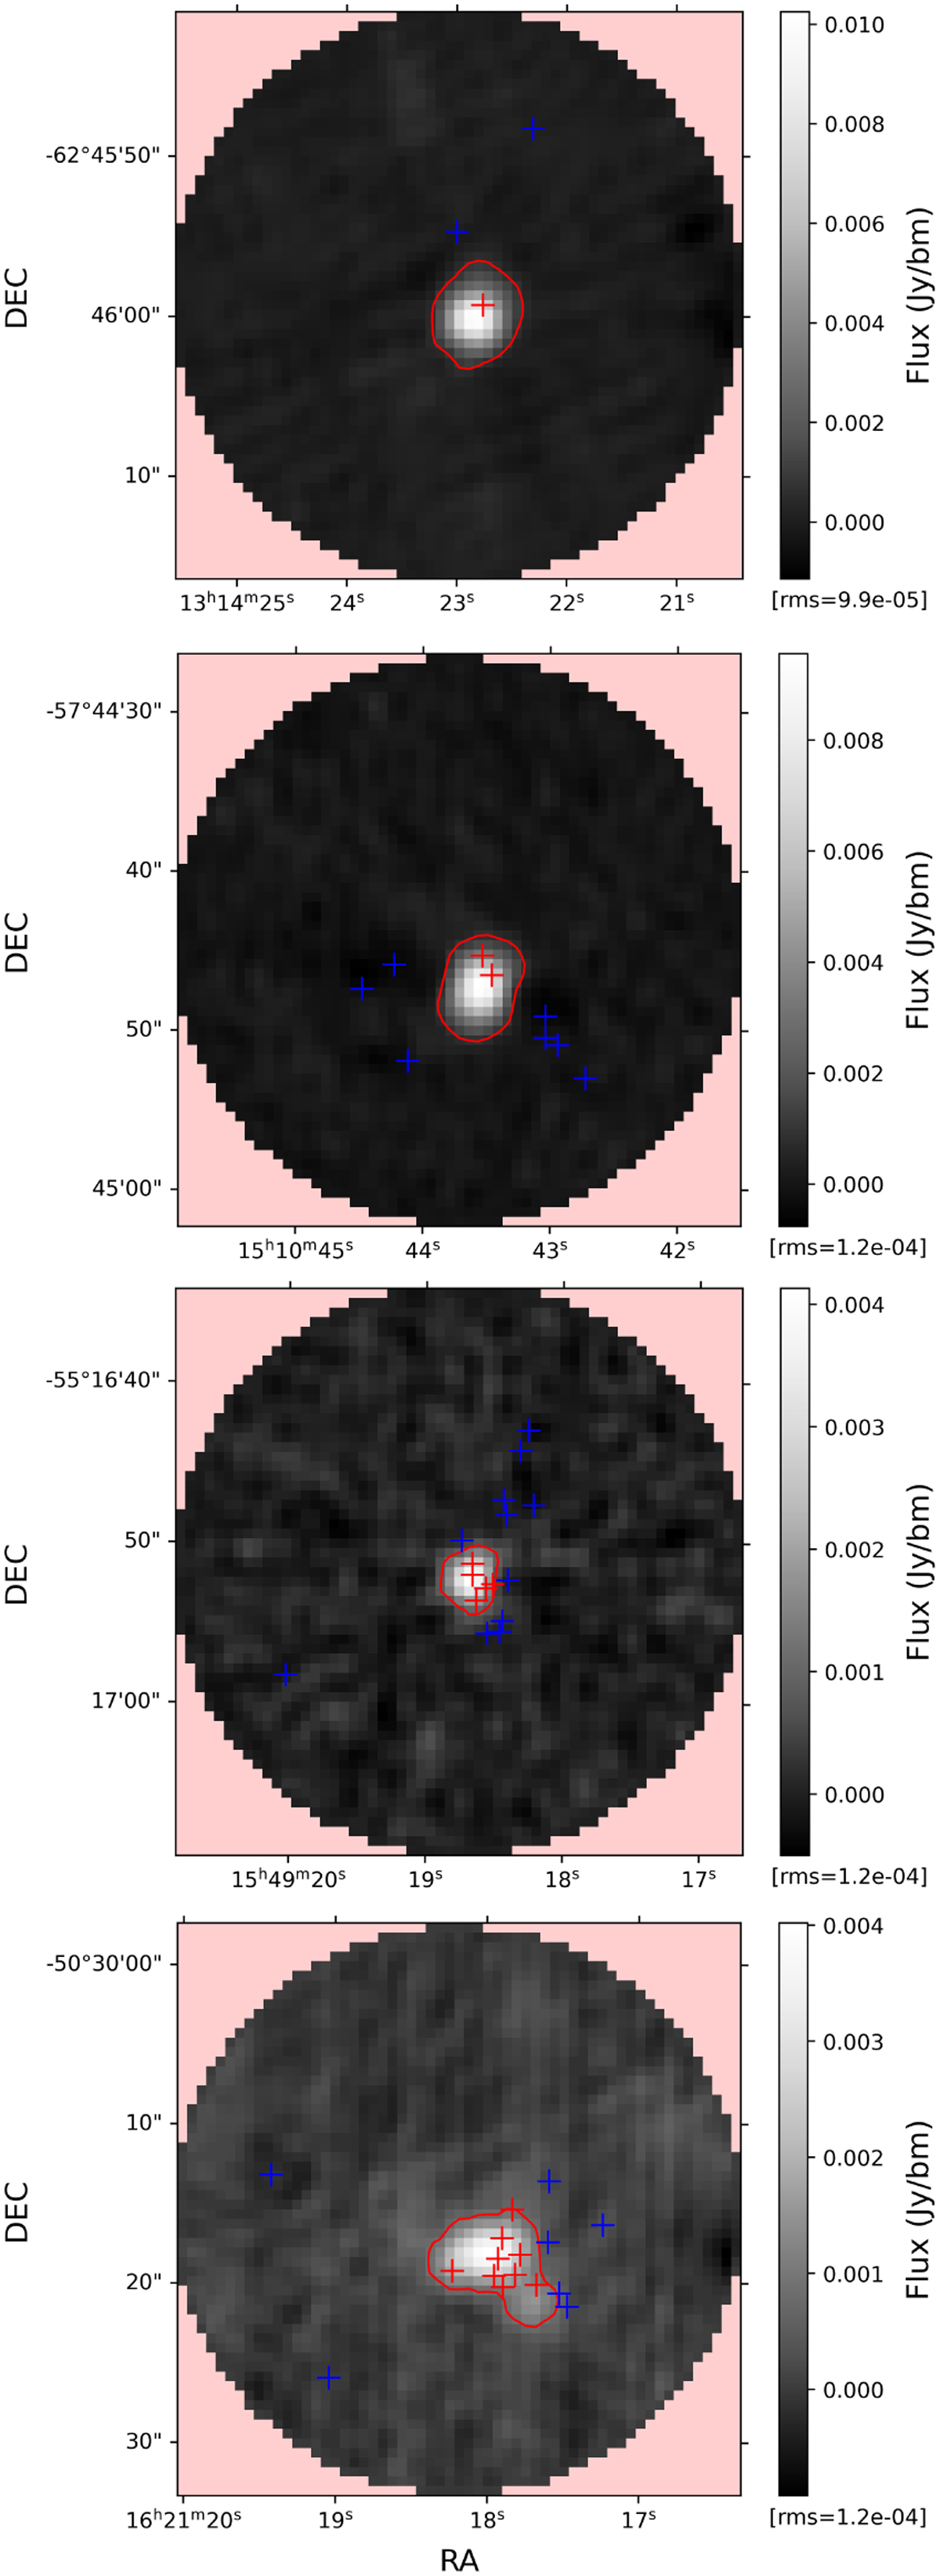
Cutouts of CORNISH/CORNISH-South radio continuum emission maps (5 GHz frequency, ~1′′ angular resolution) corresponding to the ALMAGAL fields (from top to bottom): AG305.5535-0.0114 (first panel), AG320.6753+0.2459 (second panel), AG326.4486-0.7484 (third panel), and AG333.2217-0.4020 (fourth panel). Red contour levels indicate ![]() emission regions. Red crosses mark the locations of the ALMAGAL cores that fell within such radio emission contours and are thus considered as potentially contaminated, whereas blue crosses mark the unmatched ALMAGAL cores.
emission regions. Red crosses mark the locations of the ALMAGAL cores that fell within such radio emission contours and are thus considered as potentially contaminated, whereas blue crosses mark the unmatched ALMAGAL cores.
Current usage metrics show cumulative count of Article Views (full-text article views including HTML views, PDF and ePub downloads, according to the available data) and Abstracts Views on Vision4Press platform.
Data correspond to usage on the plateform after 2015. The current usage metrics is available 48-96 hours after online publication and is updated daily on week days.
Initial download of the metrics may take a while.