Fig. A.1
Download original image
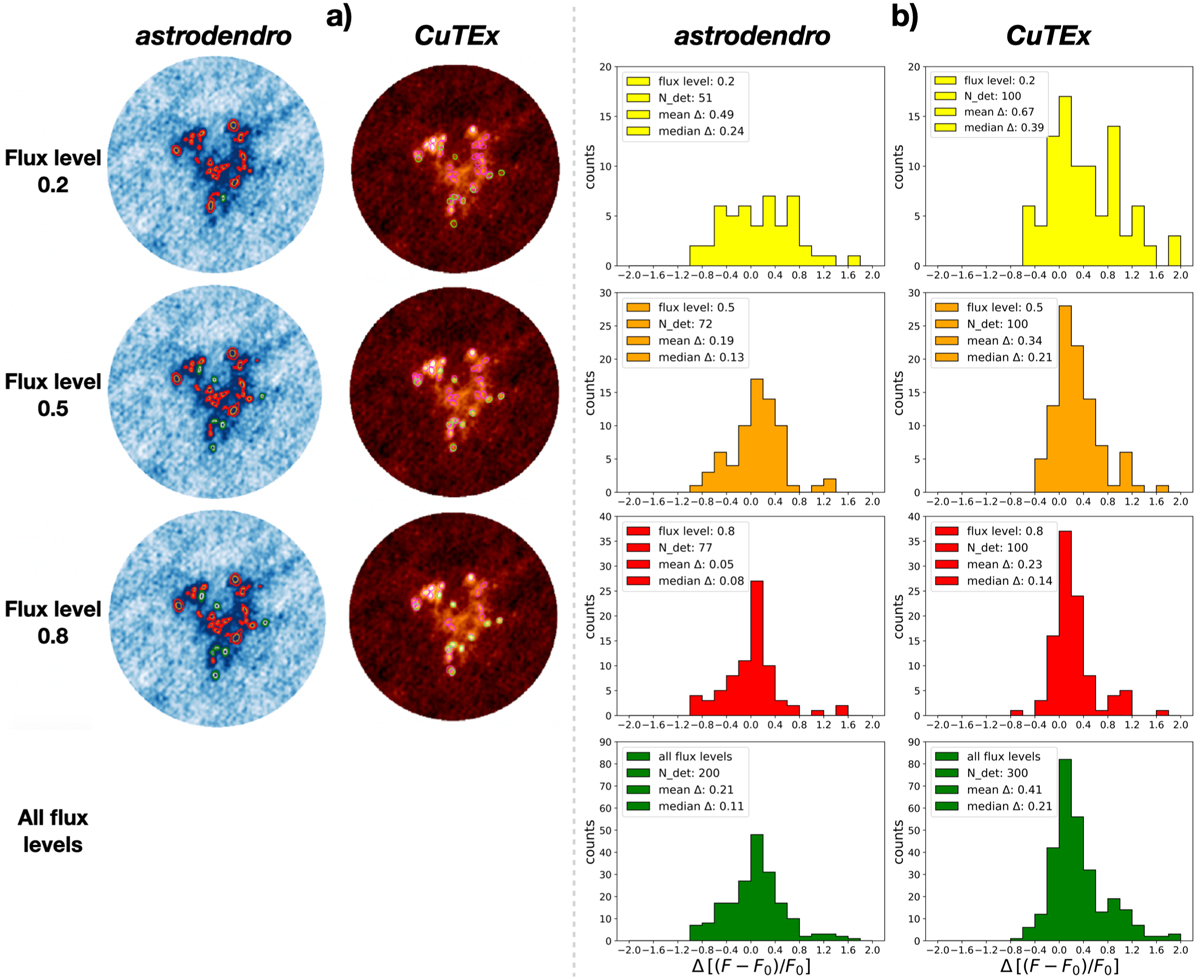
Comparison of the outcome of the source extraction tests performed with astrodendro and CuTEx. a) Comparison of the detections obtained with astrodendro (left column panels) and CuTEx (right column panels) on the continuum map of the ALMAGAL field AG304.5567+0.3273 added with 10 synthetic sources with three different flux levels (see text for details). The three flux levels reported to the side refer to fractions of the native map peak flux. Green contours/ellipses mark the detected sources that were matched with the truth tables from the simulation code (i.e., the recovered synthetic sources), while red/magenta contours/ellipses indicate detected but unmatched sources. b) Comparison of the outcome of the photometry procedure performed with the implemented version of astrodendro (left column panels) and CuTEx (right column panels) on the set of simulated maps (see text for details). In detail, histograms of the relative discrepancies (referred to as ∆) between measured integrated fluxes (F) and generated ones (F0) are shown for the matched synthetic sources detected at each flux level (100 injected sources in total, first three rows) and for all flux levels combined (300 injected sources in total, last row). Boxes within individual panels report the corresponding number of detections and the mean and median values of the relative discrepancy in the flux.
Current usage metrics show cumulative count of Article Views (full-text article views including HTML views, PDF and ePub downloads, according to the available data) and Abstracts Views on Vision4Press platform.
Data correspond to usage on the plateform after 2015. The current usage metrics is available 48-96 hours after online publication and is updated daily on week days.
Initial download of the metrics may take a while.