Fig. 2
Download original image
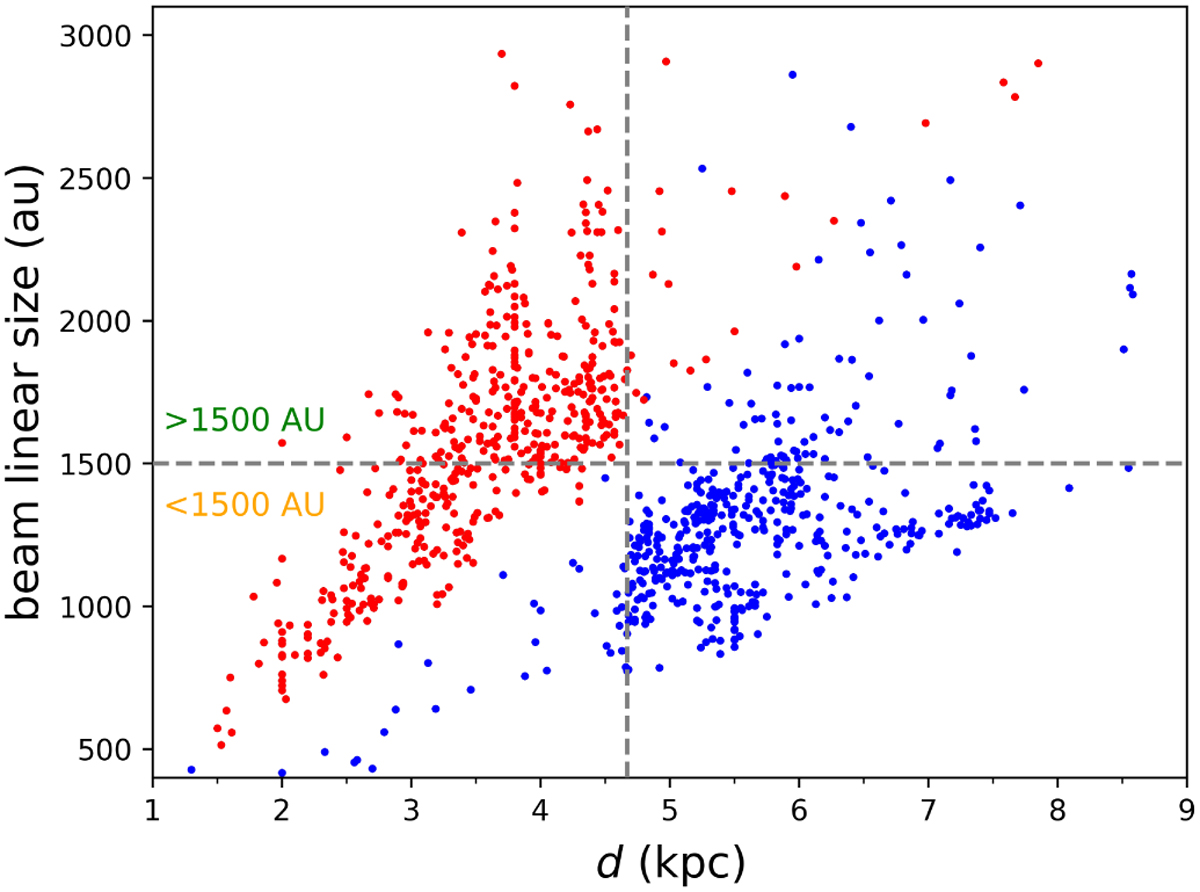
Linear size of the map beam as a function of the heliocentric distance of the ALMAGAL clumps. Targets observed with near or far sample configurations appear as red or blue points, respectively. The vertical dashed grey line marks the nominal ~4.7 kpc distance limit separating the near and far subsamples (with the few exceptions described in Sect. 2.3). The horizontal dashed grey line separates higher spatial resolution fields (i.e., beam linear size <1500 au) from lower resolution ones (>1500 au). Note: for better visualization purposes, distance and/or resolution outliers are not shown in this plot (~30 targets, ≲3%).
Current usage metrics show cumulative count of Article Views (full-text article views including HTML views, PDF and ePub downloads, according to the available data) and Abstracts Views on Vision4Press platform.
Data correspond to usage on the plateform after 2015. The current usage metrics is available 48-96 hours after online publication and is updated daily on week days.
Initial download of the metrics may take a while.