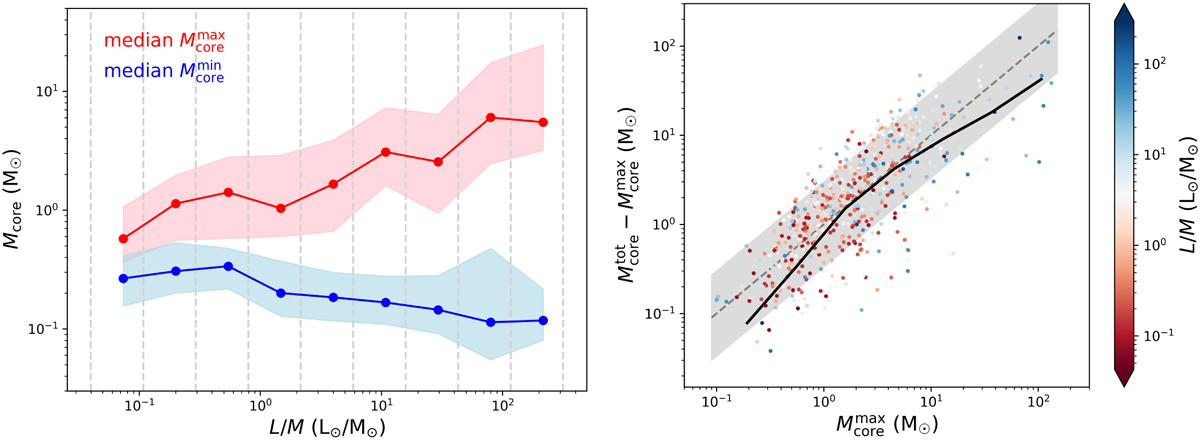
Fig. 19
Download original image
Evolution of core masses. Left panel: median values of the maximum (![]() , red) and the minimum (
, red) and the minimum (![]() , blue) core masses revealed within different bins of clump L/M (delimited by vertical dashed grey lines). The respective colored shaded areas mark the 25th and 75th percentiles of the two distributions within the same L/M bins. Right Panel: combined mass of the cores
, blue) core masses revealed within different bins of clump L/M (delimited by vertical dashed grey lines). The respective colored shaded areas mark the 25th and 75th percentiles of the two distributions within the same L/M bins. Right Panel: combined mass of the cores ![]() minus the mass of the MMC within each clump, as a function of the latter. Data points are color-coded by the clump L/M. The solid black line draws the trend of the median value of the quantity on the y-axis in given bins of
minus the mass of the MMC within each clump, as a function of the latter. Data points are color-coded by the clump L/M. The solid black line draws the trend of the median value of the quantity on the y-axis in given bins of ![]() . The dashed grey line corresponds to the
. The dashed grey line corresponds to the ![]() relation, while the shaded grey area marks (from top to bottom) the 25–75% range.
relation, while the shaded grey area marks (from top to bottom) the 25–75% range.
Current usage metrics show cumulative count of Article Views (full-text article views including HTML views, PDF and ePub downloads, according to the available data) and Abstracts Views on Vision4Press platform.
Data correspond to usage on the plateform after 2015. The current usage metrics is available 48-96 hours after online publication and is updated daily on week days.
Initial download of the metrics may take a while.