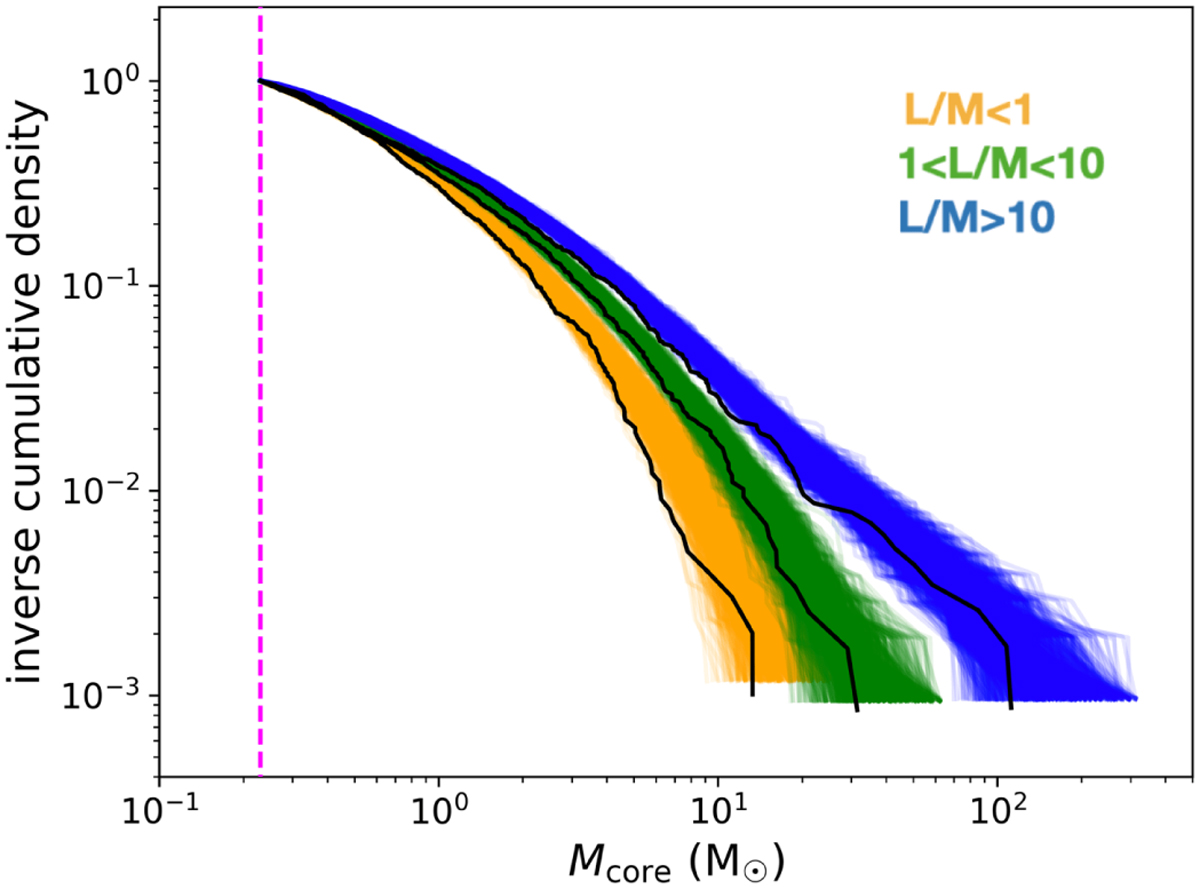
Fig. 18
Download original image
Observed CMFs (black lines, expressed as inverse cumulative number density distributions) for the three populations of ALMAGAL cores classified, as reported, according to the L/M evolutionary indicator of the hosting clump, as explained in Sect. 5.2.1. The three colored bands trace, for each population, the 1000 MC realizations of CMFs computed by assigning to each core a random temperature within the ranges defined in Table 6. Less evolved sources (i.e., with L/M ≤ 1 L⊙/M⊙) are marked by golden lines, the intermediate ones (1 < L/M ≤ 10 L⊙/M⊙) by green lines, and the more evolved sources (L/M > 10 L⊙/M⊙) by blue lines. Note: we include only cores above the mass completeness value of 0.23 M⊙, marked by the vertical dashed magenta line (see text for explanation).
Current usage metrics show cumulative count of Article Views (full-text article views including HTML views, PDF and ePub downloads, according to the available data) and Abstracts Views on Vision4Press platform.
Data correspond to usage on the plateform after 2015. The current usage metrics is available 48-96 hours after online publication and is updated daily on week days.
Initial download of the metrics may take a while.