Fig. 16
Download original image
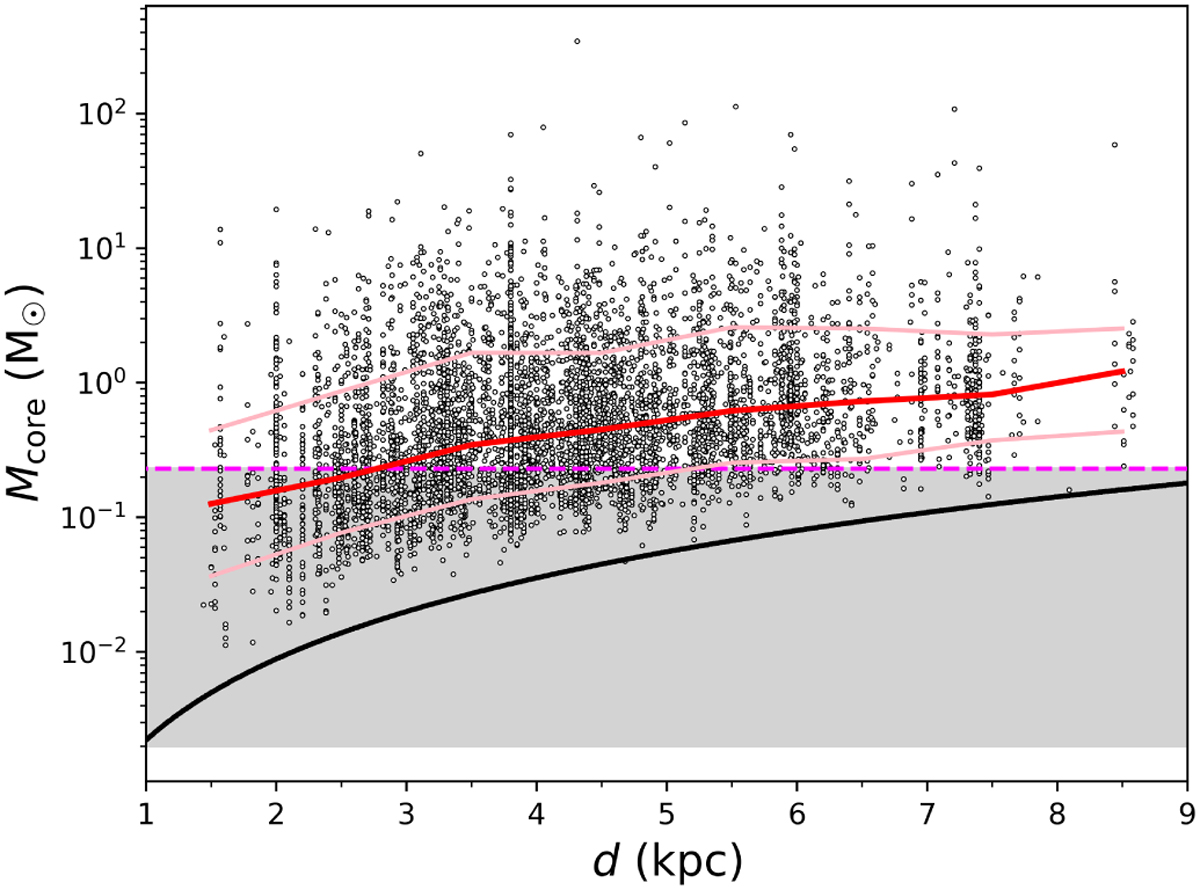
Estimated core masses as a function of the hosting clump heliocentric distance, highlighting the variation of mass sensitivity across distance. The red line draws the trend of the median value among core masses contained within 1 kpc bins of distance, and the two pink lines mark the position of the 15th (bottom) and 85th (top) percentiles of the mass distribution within the same distance bins. The horizontal dashed magenta line marks the mass completeness limit of 0.23 M⊙, while the solid black curve is drawn to approximately follow the trend of the minimum core mass revealed with target distance. The grey shaded area highlights the incomplete part of the sample, and, in particular, the region below the black curve represents the “forbidden” (i.e., not detectable) range of masses based on revealed objects at the different target distances. Note: for better visualization purposes, distance outliers (<3%) are not shown in this plot.
Current usage metrics show cumulative count of Article Views (full-text article views including HTML views, PDF and ePub downloads, according to the available data) and Abstracts Views on Vision4Press platform.
Data correspond to usage on the plateform after 2015. The current usage metrics is available 48-96 hours after online publication and is updated daily on week days.
Initial download of the metrics may take a while.