Fig. 14
Download original image
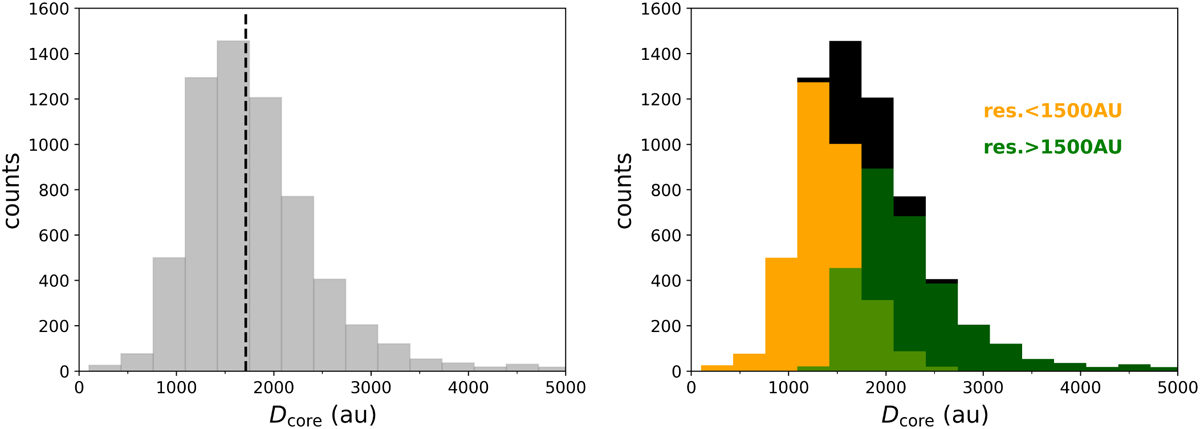
Distribution of the cores’ estimated physical sizes (i.e., diameters). Left panel: overall distribution of core sizes. The vertical dashed black line marks the median value of the distribution (1700 au). For better visualization purposes, the few outliers above 5000 au (∼2%) are not shown. Right panel: same distribution of left panel (black), but overplotted with the core size distributions resulting from better resolved fields (gold, below 1500 au) and less resolved ones (dark green, above 1500 au). The two histograms overlap in the lighter green area.
Current usage metrics show cumulative count of Article Views (full-text article views including HTML views, PDF and ePub downloads, according to the available data) and Abstracts Views on Vision4Press platform.
Data correspond to usage on the plateform after 2015. The current usage metrics is available 48-96 hours after online publication and is updated daily on week days.
Initial download of the metrics may take a while.