Fig. 11
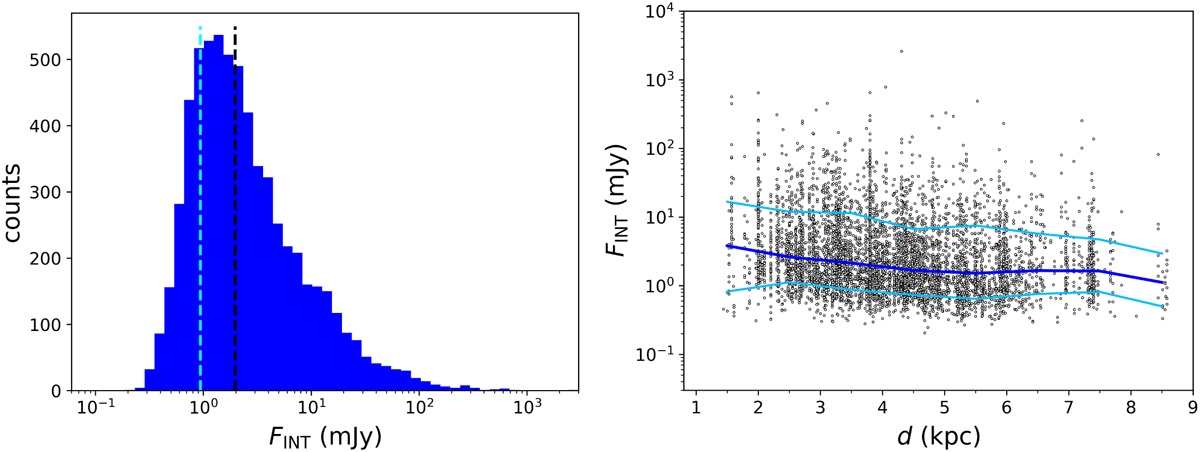
Download original image
Integrated fluxes of the extracted compact sources as estimated with CuTEx. Left panel: overall distribution of the integrated fluxes of the sources. The adopted flux completeness value of 0.94 mJy (see Sect. 3.3) is marked by the vertical dashed cyan line. The vertical dashed black line marks the median value of the distribution (2 mJy). Right panel: measured integrated fluxes of the sources as a function of the hosting clump distance. The solid blue line traces the median FINT values within given bins of distance. Light blue lines correspond to the 15th (bottom) and 85th (top) percentiles of the flux distribution in the same bins of distance. Note: for improved visualization, distance outliers (<3%) are not shown in this plot.
Current usage metrics show cumulative count of Article Views (full-text article views including HTML views, PDF and ePub downloads, according to the available data) and Abstracts Views on Vision4Press platform.
Data correspond to usage on the plateform after 2015. The current usage metrics is available 48-96 hours after online publication and is updated daily on week days.
Initial download of the metrics may take a while.