Fig. 7
Download original image
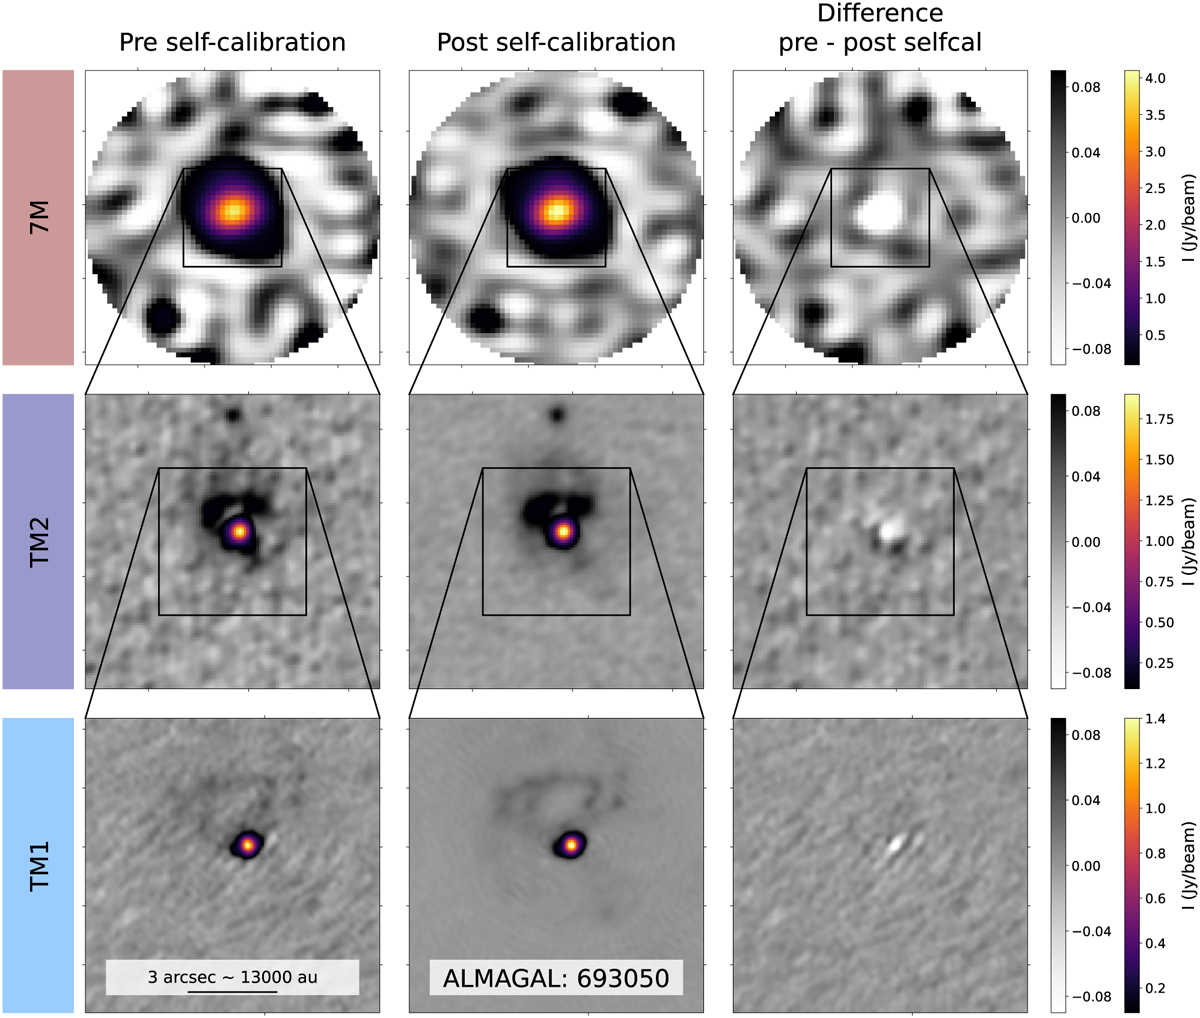
ALMAGAL self-calibration results for target 693050 (also labelled AG301.1365–0.2259 in Molinari et al. 2025). From top to bottom, the different rows show the 7M, TM2, and TM1 images. For all three arrays, the left column shows the continuum emission image before self-calibration, the middle column shows the continuum image after self-calibration, and the right column shows the differences of the two images (i.e., pre self-calibrated minus post self-calibrated images). The intensity scales are fixed for each row (i.e., each array). This field is an example of a bright and compact source, where self-calibration improves the rms noise level removing phase-noise fluctuations throughout the image (see TM2 and TM1 panels). In all images throughout the paper we use a double color bar to better emphasize both the weak, extended emission (in grey colors) and bright, compact regions (in magma colors).
Current usage metrics show cumulative count of Article Views (full-text article views including HTML views, PDF and ePub downloads, according to the available data) and Abstracts Views on Vision4Press platform.
Data correspond to usage on the plateform after 2015. The current usage metrics is available 48-96 hours after online publication and is updated daily on week days.
Initial download of the metrics may take a while.