Fig. 6
Download original image
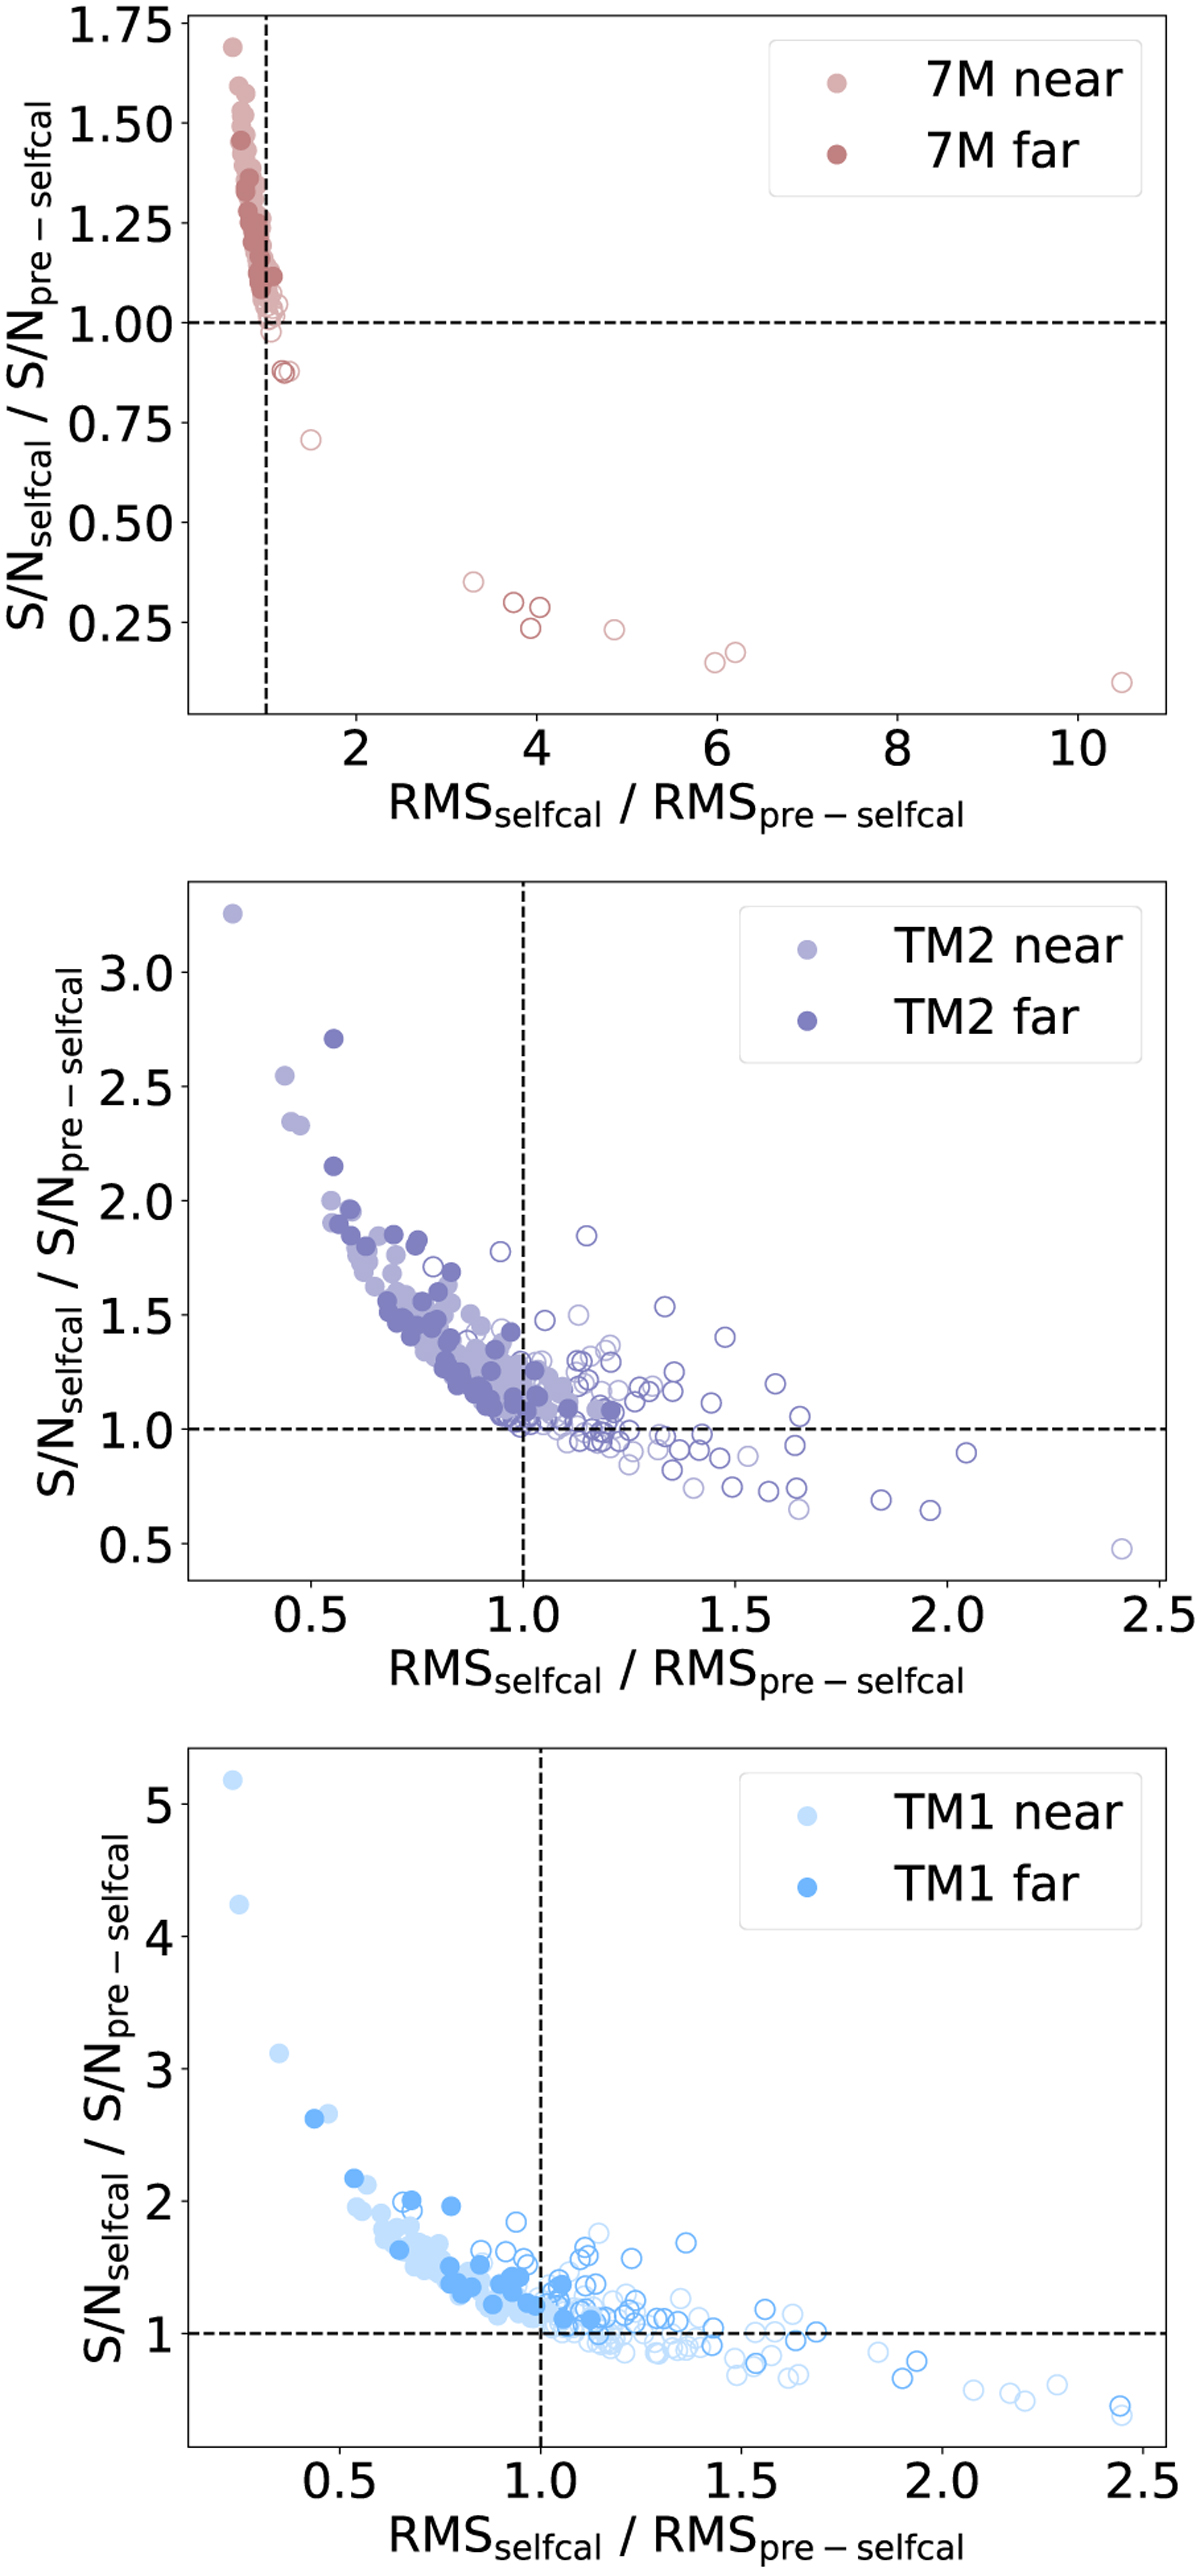
Signal-to-noise ratio (S/N) and rms noise level (RMS) for those ALMAGAL fields where self-calibration is possible (i.e., S/Nselfcal > 3). The y-axis shows the ratio of the S/N after self-calibration with respect to the original S/N, while the x-axis shows the corresponding ratio for the rms noise level. Filled circles correspond to those sources where self-calibration improved the final images and the solutions were applied. Empty circles show those sources where self-calibration, even if originally possible, did not improve the quality of the image (e.g., due to coarser angular resolution images, see Sect. 4.3), and therefore the solutions were not applied. From top to bottom, the different panels show the results for the 7M, TM2, and TM1 arrays.
Current usage metrics show cumulative count of Article Views (full-text article views including HTML views, PDF and ePub downloads, according to the available data) and Abstracts Views on Vision4Press platform.
Data correspond to usage on the plateform after 2015. The current usage metrics is available 48-96 hours after online publication and is updated daily on week days.
Initial download of the metrics may take a while.