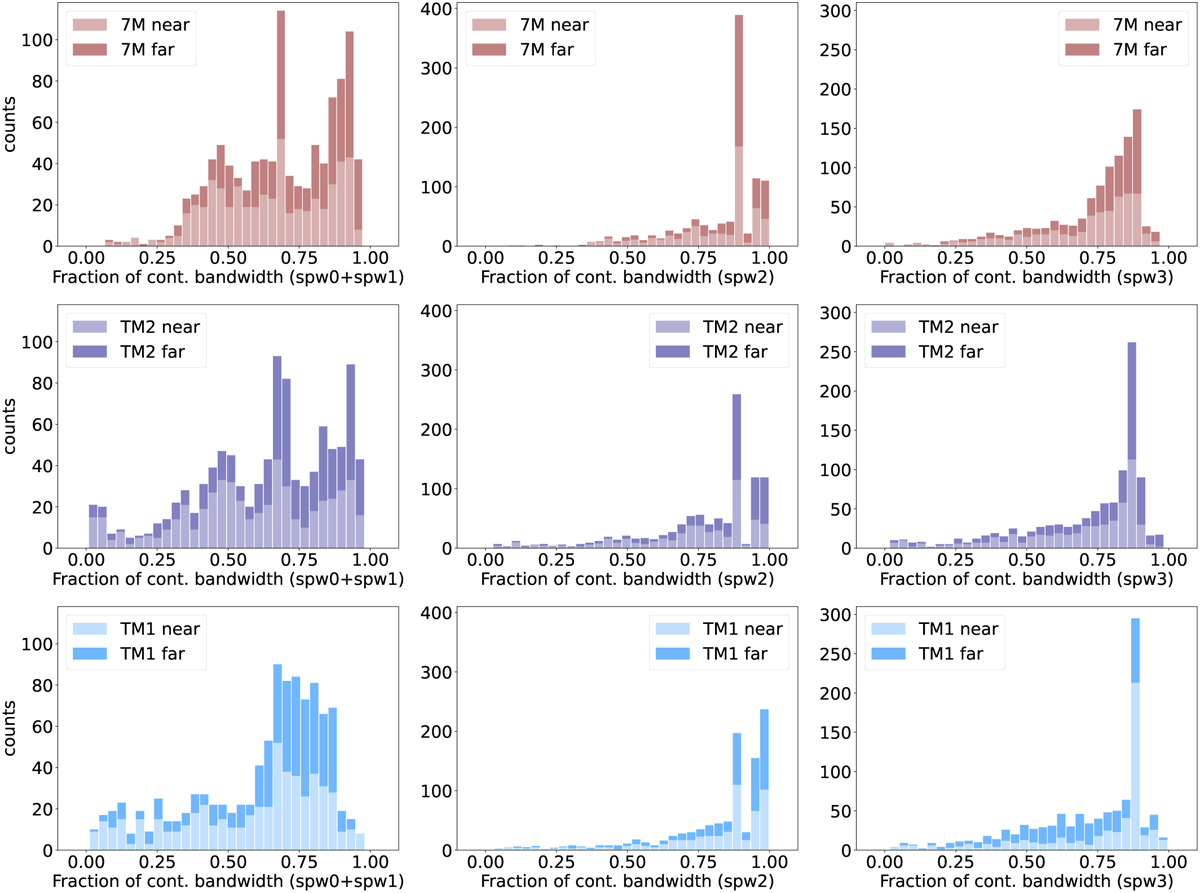
Fig. 5
Download original image
Distribution of the fraction of final continuum bandwidth determined with the improved version of findcont (see Sect. 4.2) for different spectral windows (columns) and array configurations (rows). The y-axis in all panels depicts the number of ALMAGAL fields. Lighter and darker histograms show data for sources in the “Near” and “Far” samples, respectively. The fraction of bandwidth indicated in the histograms is normalized to the total bandwidth, which is 3.75 GHz for spw0+spw1 (left column), 0.468 GHz for spw2 (middle column), and 0.468 GHz for spw3 (right column).
Current usage metrics show cumulative count of Article Views (full-text article views including HTML views, PDF and ePub downloads, according to the available data) and Abstracts Views on Vision4Press platform.
Data correspond to usage on the plateform after 2015. The current usage metrics is available 48-96 hours after online publication and is updated daily on week days.
Initial download of the metrics may take a while.