Fig. 3
Download original image
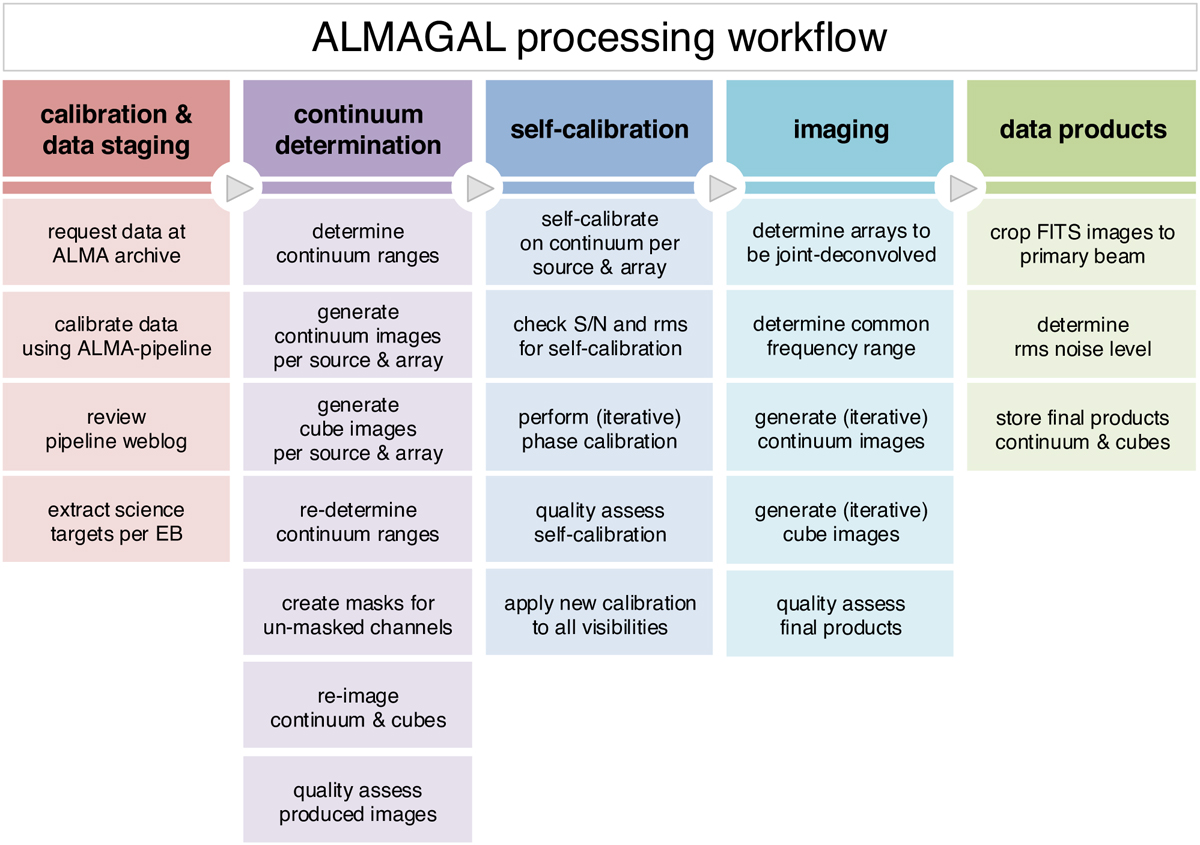
ALMAGAL processing workflow. Schematic description of the five major steps. The process starts with “calibration and data staging”, preparing the data for the following steps (Sect. 4.1). We then determine line-free frequency ranges for the continuum emission, and generate a first set of images for each source and individual array (Sect. 4.2). The next step applies an automatized self-calibration process to each source and individual array (Sect. 4.3). The self-calibrated data of each array are then joint-deconvolved together to produce final images of continuum emission and line cubes (Sect. 4.4). Finally, the data products are quality assessed and stored for distribution to the consortium (Sect. 4.5).
Current usage metrics show cumulative count of Article Views (full-text article views including HTML views, PDF and ePub downloads, according to the available data) and Abstracts Views on Vision4Press platform.
Data correspond to usage on the plateform after 2015. The current usage metrics is available 48-96 hours after online publication and is updated daily on week days.
Initial download of the metrics may take a while.