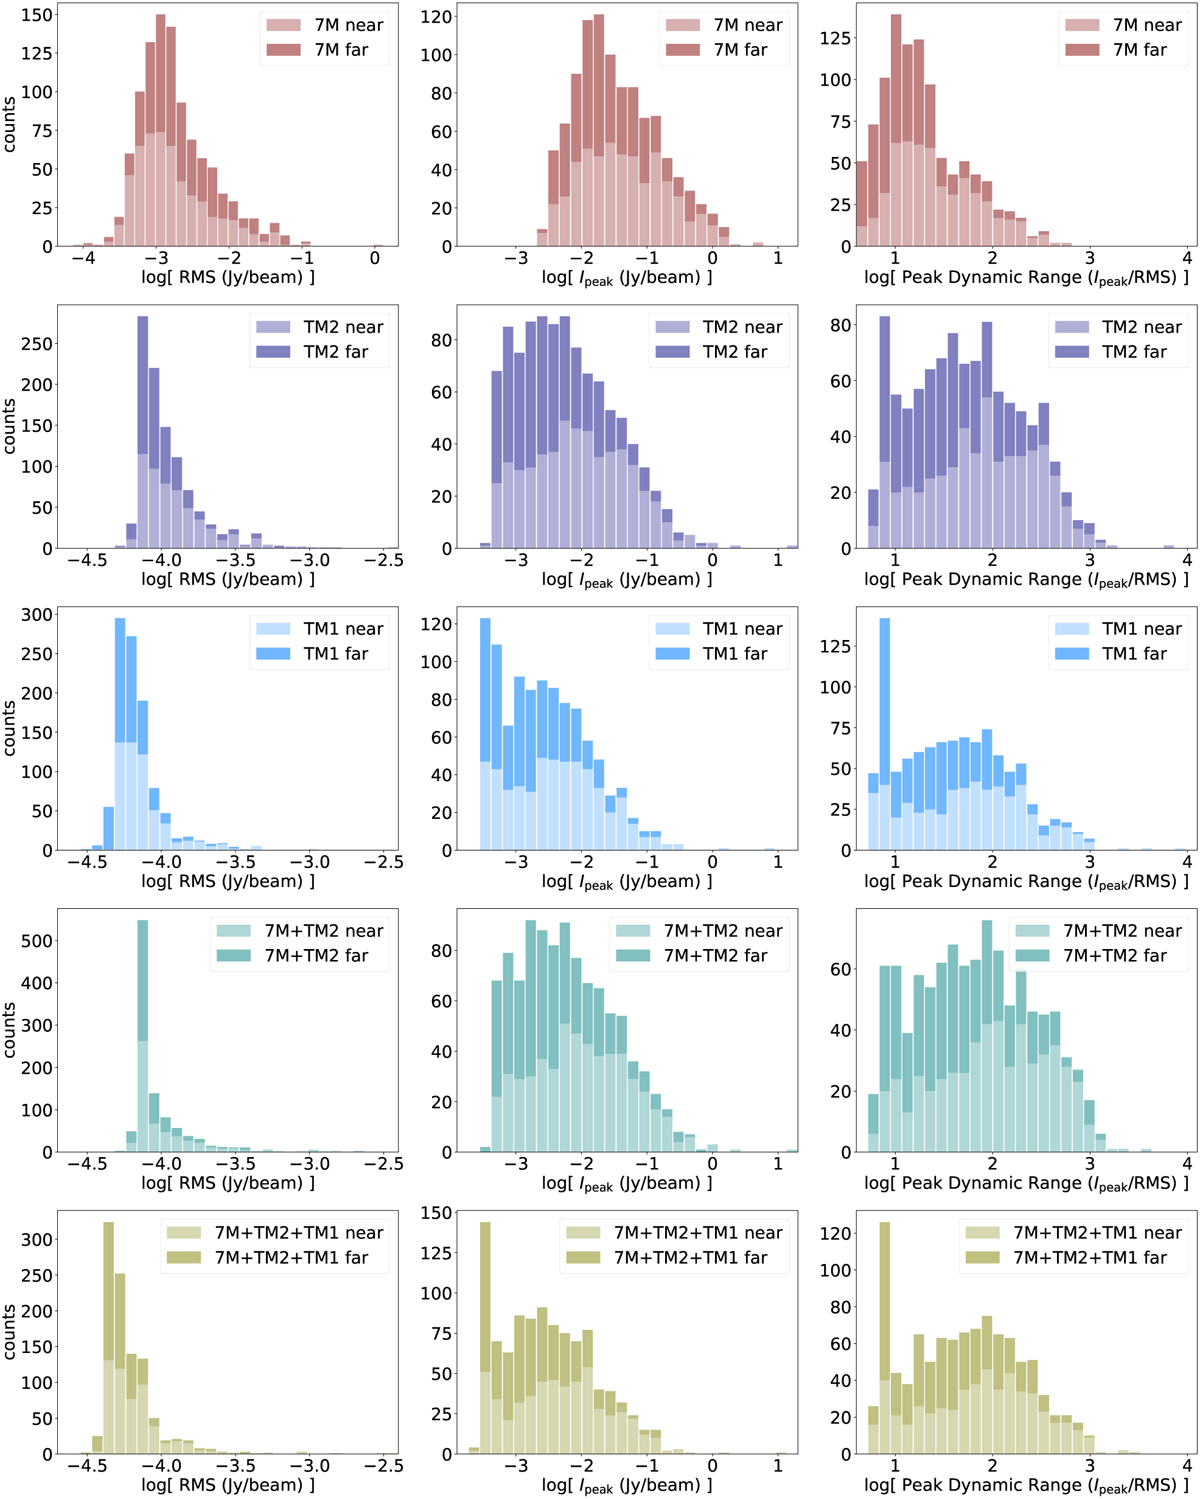
Fig. B.4
Download original image
Distribution of the noise level (left column), peak intensity (central column), and dynamic range (right column) for the continuum ALMAGAL images. The y-axis in all panels depicts the number of images. From top to bottom, each row corresponds to the images for the 7M, TM2, TM1, 7M+TM2, and 7M+TM2+TM1 array configurations. The dynamic range (or signal-to-noise ratio) is determined as the ratio between the peak intensity and the noise level, with the noise level derived as the median absolute deviation (MAD) of the residual image (see Sect. 4.5.3).
Current usage metrics show cumulative count of Article Views (full-text article views including HTML views, PDF and ePub downloads, according to the available data) and Abstracts Views on Vision4Press platform.
Data correspond to usage on the plateform after 2015. The current usage metrics is available 48-96 hours after online publication and is updated daily on week days.
Initial download of the metrics may take a while.