Fig. B.1
Download original image
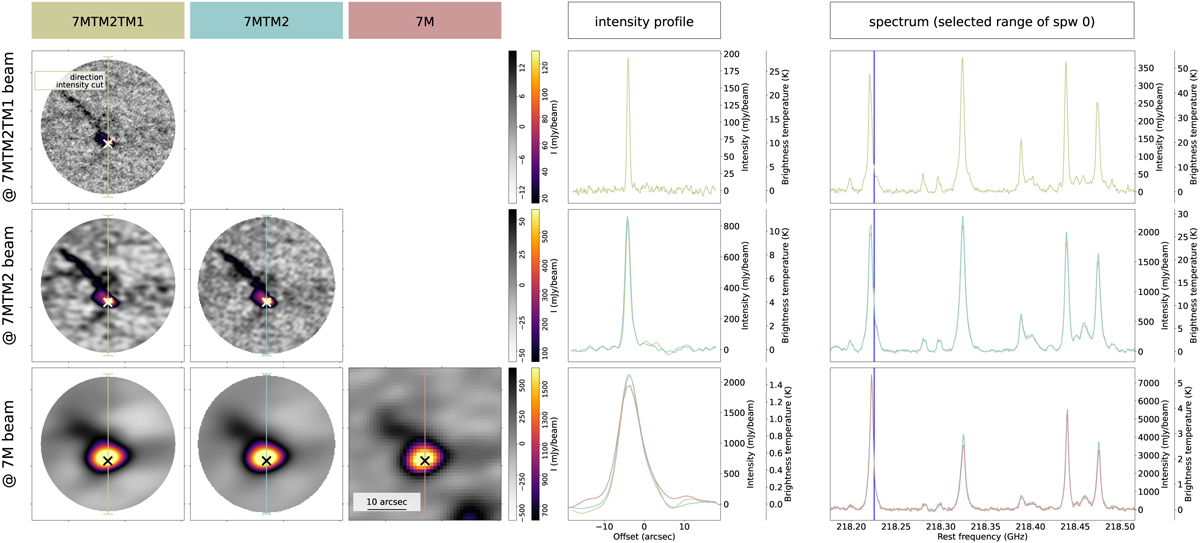
Comparison of the ALMAGAL images for field 101899 (also labelled AG023.0108–0.4102 in Molinari et al. 2025) to explore the quality of the data combination in data cubes. The figure is divided in three main sections: left columns (with titles 7MTM2TM1, 7MTM2 and 7M), middle column (with title “intensity profile”), and right column (with title “spectrum”). Left columns: The images shown in the panels of the left columns correspond to the emission of a specific channel in the spw0 data cube. The channel is highlighted with a blue vertical solid line in the spectra shown in the right column panels. The images have been convolved to different angular resolutions in the different rows: The top row shows images convolved to the 7M+TM2+TM1 beam (![]() ), the middle row corresponds to images convolved to the 7M+TM2 beam (
), the middle row corresponds to images convolved to the 7M+TM2 beam (![]() ), and the bottom row shows the images convolved to the 7M-only beam (
), and the bottom row shows the images convolved to the 7M-only beam (![]() ). The first three columns correspond to the images of the arrays 7M+TM2+TM1, 7M+TM2 and 7M, from left to right, respectively. Middle column: The panels in this column show the intensity profiles (both in intensity, mJy beam−1, and in brightness temperature, K) of the vertical intensity cuts indicated in the different images. Right column: The spectra shown in these panels are extracted towards the position marked with a white/black cross in the images shown in the left columns panels. They depict a portion of the frequency coverage of the spectral window spw0.
). The first three columns correspond to the images of the arrays 7M+TM2+TM1, 7M+TM2 and 7M, from left to right, respectively. Middle column: The panels in this column show the intensity profiles (both in intensity, mJy beam−1, and in brightness temperature, K) of the vertical intensity cuts indicated in the different images. Right column: The spectra shown in these panels are extracted towards the position marked with a white/black cross in the images shown in the left columns panels. They depict a portion of the frequency coverage of the spectral window spw0.
Current usage metrics show cumulative count of Article Views (full-text article views including HTML views, PDF and ePub downloads, according to the available data) and Abstracts Views on Vision4Press platform.
Data correspond to usage on the plateform after 2015. The current usage metrics is available 48-96 hours after online publication and is updated daily on week days.
Initial download of the metrics may take a while.