Fig. A.1
Download original image
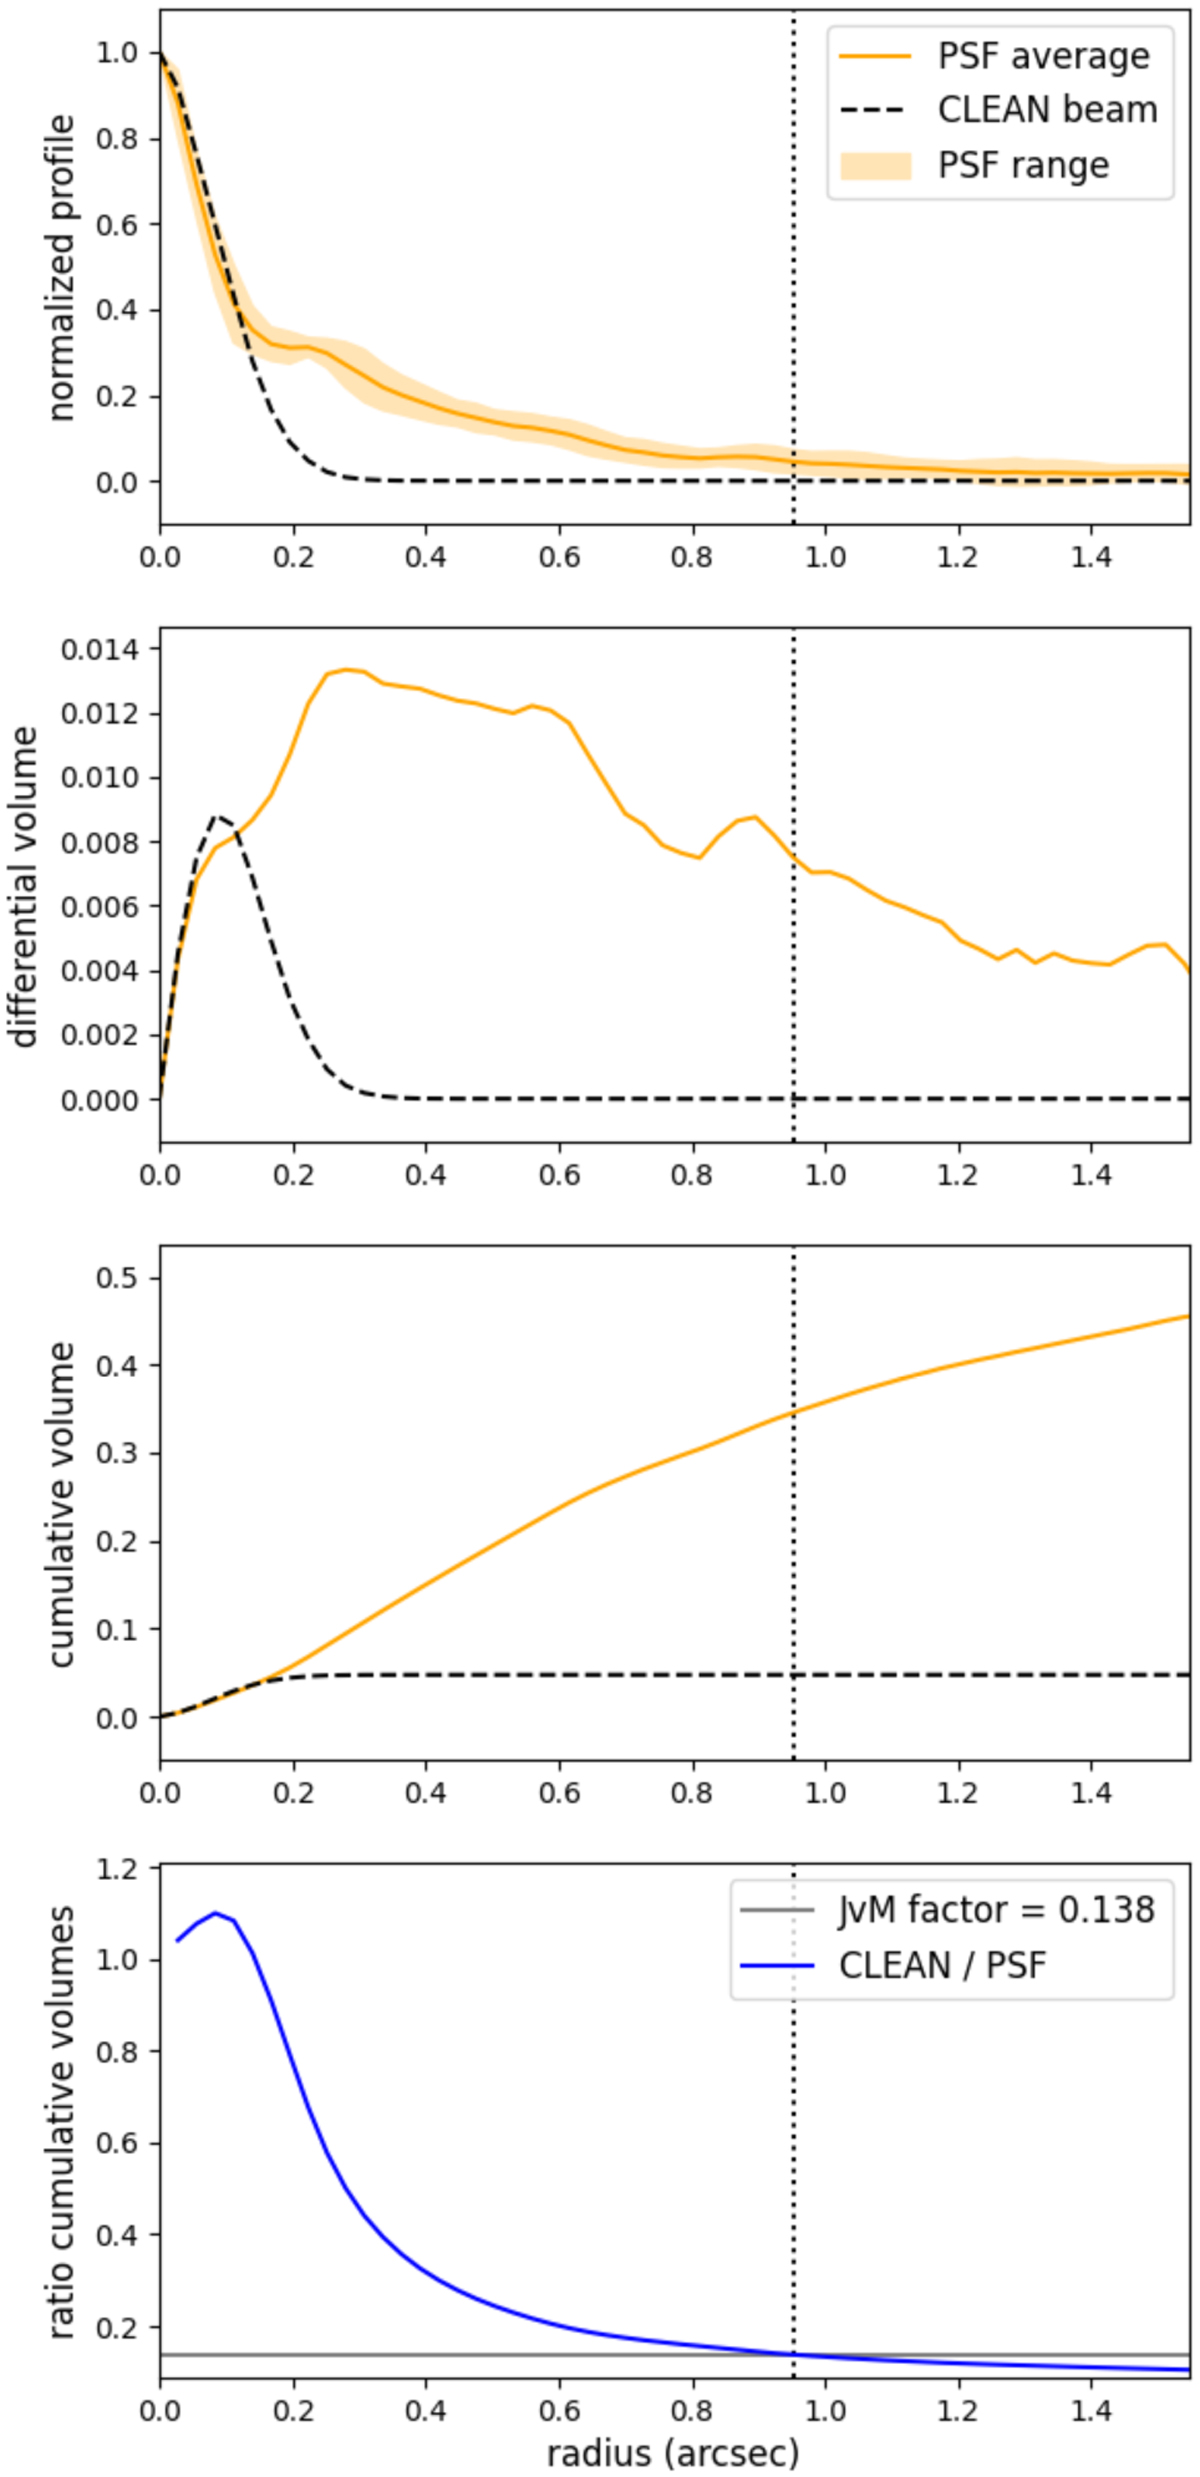
Set of images describing the procedure used to determine the ϵ correction factor (or JvM-factor) based on Czekala et al. (2021). The plots refer to the 7M+TM2+TM1 continuum data of the ALMAGAL field 644284 (also labelled AG285.2633–0.0501 in Molinari et al. 2025). Top panel: normalized, elliptically averaged profile of the dirty beam (or PSF, in orange) and clean beam (black dashed line). The vertical dotted line marks the “zero-crossing” point of the dirty beam. Note that the PSF range of the elliptically averaged dirty beam is considered to determine the crossing point, thus resulting in a more conservative correction factor. Second and third panels: differential and cumulative volumes of the dirty and clean beams (see Czekala et al. 2021 for details in the calculation). Bottom panel: ratio of the clean and dirty beam volumes. The value of this ratio at the distance of the dirty-beam zerocrossing point provides the ϵ (or JvM) correction factor (0.138 in this example).
Current usage metrics show cumulative count of Article Views (full-text article views including HTML views, PDF and ePub downloads, according to the available data) and Abstracts Views on Vision4Press platform.
Data correspond to usage on the plateform after 2015. The current usage metrics is available 48-96 hours after online publication and is updated daily on week days.
Initial download of the metrics may take a while.