Fig. 18
Download original image
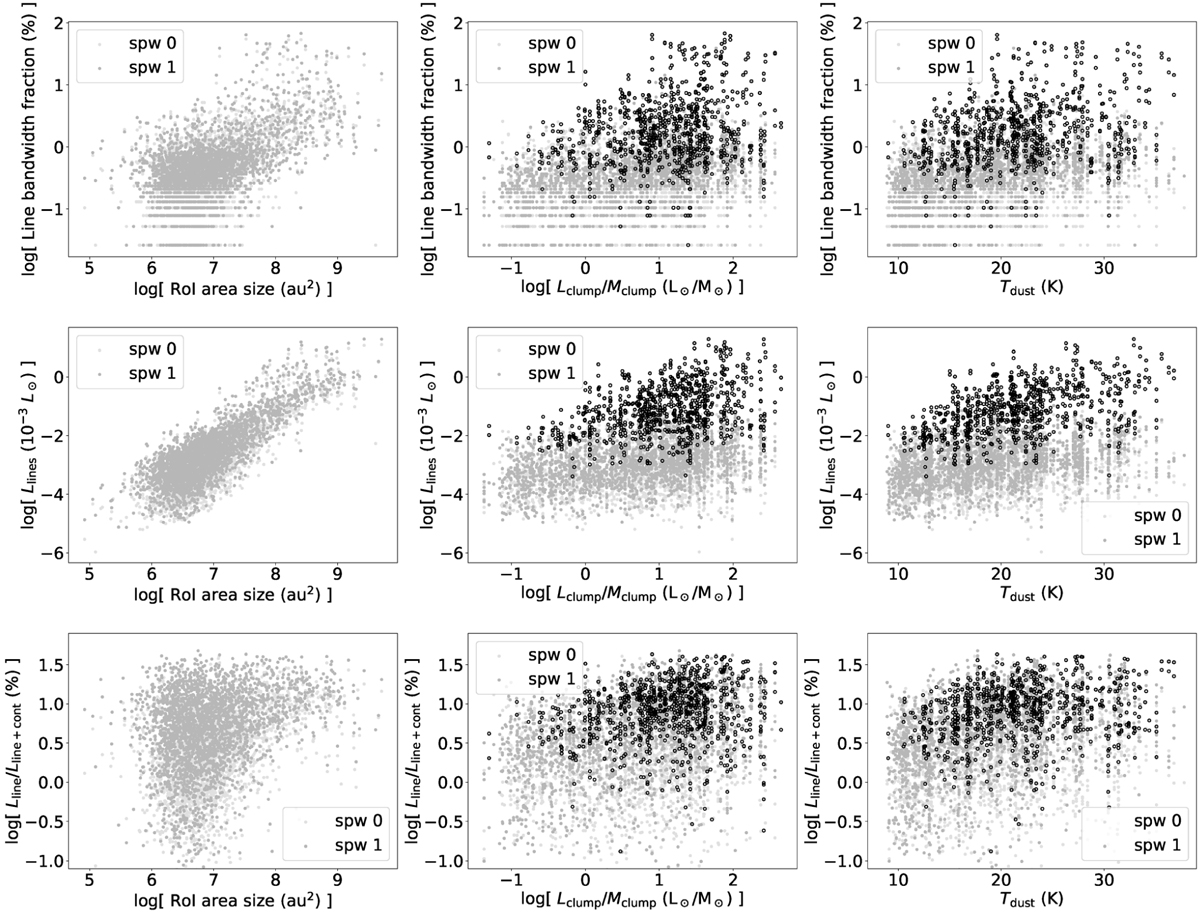
Relation between the parameters describing the line richness of the RoIs and physical properties of the hosting ALMAGAL clumps. From top to bottom, the different rows show the fraction of bandwidth with line emission, the line luminosity, and the fraction of line luminosity to total luminosity. From left to right, the different columns show the size of the RoI area, the clump luminosity-to-mass ratio (Lclump/Mclump) as an indicator of evolutionary stage, and the clump dust temperature (Tdust). No significant difference is seen for the spw 0 (lighter grey) and spw 1 (darker grey) data. Black symbols in the middle and right-column panels correspond to those RoIs with area sizes larger than 3.2 × 10⁷ au2, corresponding to the 84th percentile of the RoI area sizes shown in the left-column panels.
Current usage metrics show cumulative count of Article Views (full-text article views including HTML views, PDF and ePub downloads, according to the available data) and Abstracts Views on Vision4Press platform.
Data correspond to usage on the plateform after 2015. The current usage metrics is available 48-96 hours after online publication and is updated daily on week days.
Initial download of the metrics may take a while.