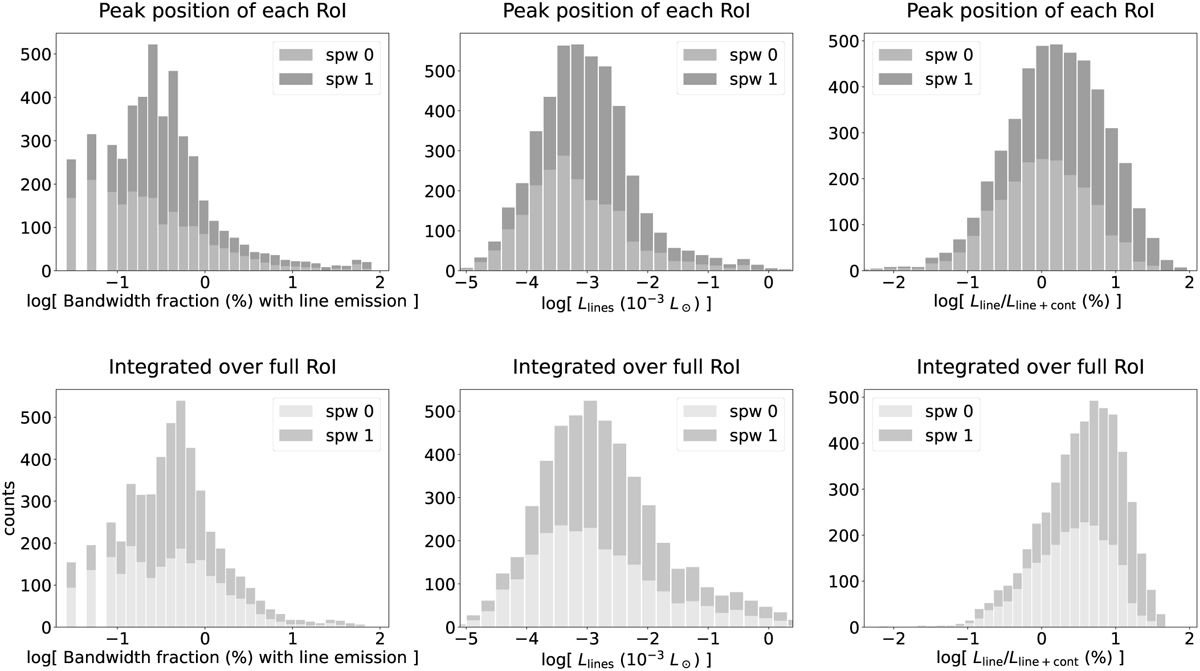
Fig. 17
Download original image
Distribution of spectral line properties towards the regions of interest (RoIs) of the ALMAGAL fields. The y-axis in all panels depicts the number of RoIs. From left to right columns, the panels show the fraction of bandwidth with line emission, the luminosity contained in spectral lines, and the fraction of line luminosity to total luminosity (continuum and lines). The top panels show the distributions for the spectra extracted towards the continuum intensity peak of each RoI, while the bottom panels show the results for the spectra extracted integrated over the whole RoI. See Sect. 5.2 for more details.
Current usage metrics show cumulative count of Article Views (full-text article views including HTML views, PDF and ePub downloads, according to the available data) and Abstracts Views on Vision4Press platform.
Data correspond to usage on the plateform after 2015. The current usage metrics is available 48-96 hours after online publication and is updated daily on week days.
Initial download of the metrics may take a while.