Fig. 16
Download original image
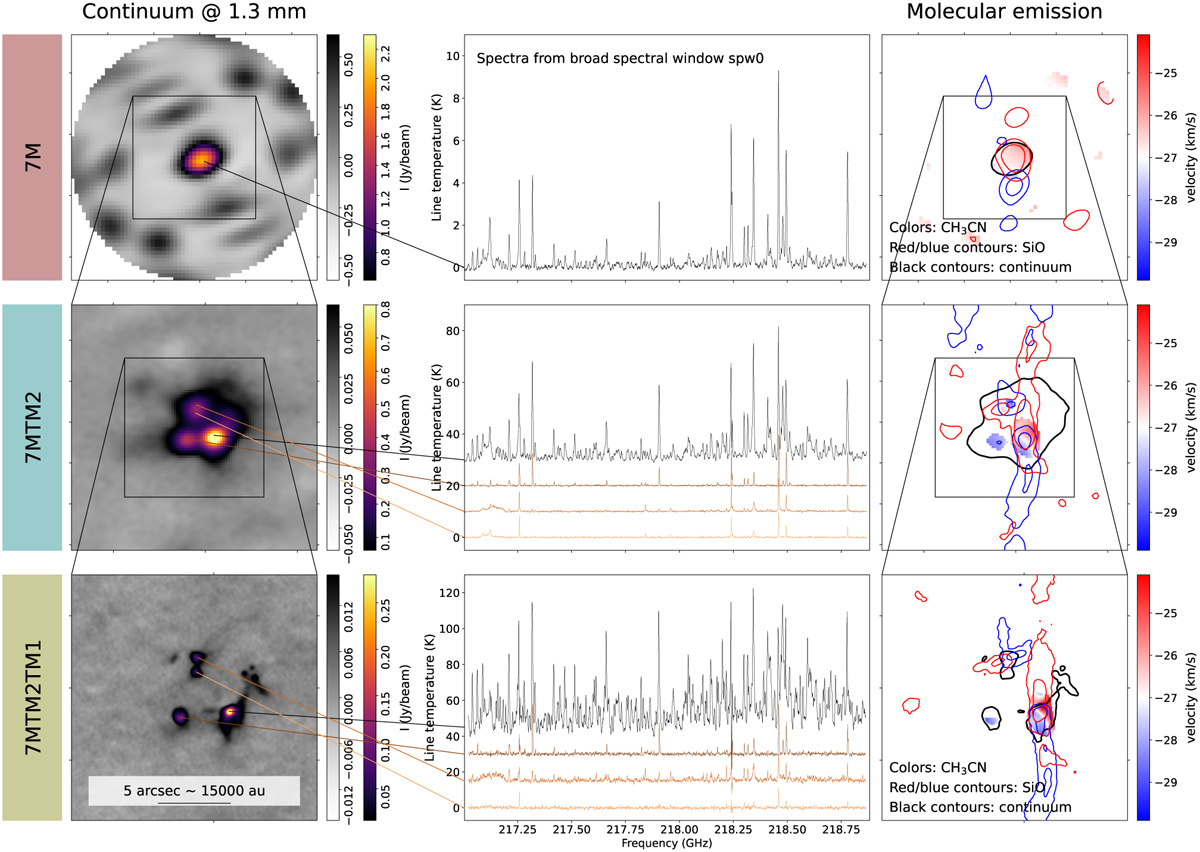
Continuum and spectral line results towards the ALMAGAL field 865468 (also labelled AG345.0035–0.2240 in Molinari et al. 2025). From top to bottom, results for the 7M (beam size of ![]() ), 7M+TM2 (beam size of
), 7M+TM2 (beam size of ![]() ), and 7M+TM2+TM1 (beam size of
), and 7M+TM2+TM1 (beam size of ![]() ) images. The left-column panels show the dust continuum emission at 219 GHz (or 1.38 mm). The middle-column panels show the spectra towards different compact sources identified in the continuum images. The right-column panels show the emission for two molecular spectral lines: SiO (5–4) and CH3CN (12K=3−11K=3). The color image shows the first order moment map, or velocity field of the CH3CN line over a velocity range from −37 to −17 km s−1 (the systemic velocity of the region is −27 km s−1). The blue and red contours show zero-th order moment maps (or integrated emission) of the blue-shifted (from −100 to −37 km s−1) and red-shifted (from −17 to 46 km s−1) SiO emission, respectively. The black contour depicts the spatial distribution of the continuum emission as shown in the left-column panels.
) images. The left-column panels show the dust continuum emission at 219 GHz (or 1.38 mm). The middle-column panels show the spectra towards different compact sources identified in the continuum images. The right-column panels show the emission for two molecular spectral lines: SiO (5–4) and CH3CN (12K=3−11K=3). The color image shows the first order moment map, or velocity field of the CH3CN line over a velocity range from −37 to −17 km s−1 (the systemic velocity of the region is −27 km s−1). The blue and red contours show zero-th order moment maps (or integrated emission) of the blue-shifted (from −100 to −37 km s−1) and red-shifted (from −17 to 46 km s−1) SiO emission, respectively. The black contour depicts the spatial distribution of the continuum emission as shown in the left-column panels.
Current usage metrics show cumulative count of Article Views (full-text article views including HTML views, PDF and ePub downloads, according to the available data) and Abstracts Views on Vision4Press platform.
Data correspond to usage on the plateform after 2015. The current usage metrics is available 48-96 hours after online publication and is updated daily on week days.
Initial download of the metrics may take a while.