Fig. 2
Download original image
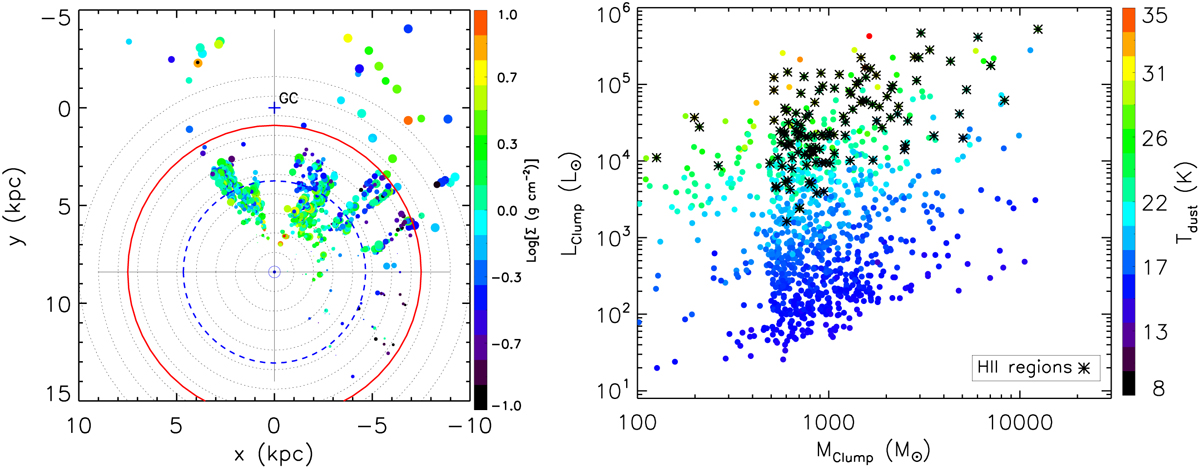
Left panel: Galactic distribution of ALMAGAL target clumps are shown on the left, with a symbol size of ∝log(Mc) (clump mass) and color coded by Σc (surface density), as determined from the Hi-GAL data (non-beam-deconvolved), reflecting the updated distances and physical parameters described in Sect. 3.2 and reported in Table 1, available at the CDS. Dotted circles represent 1 kpc distance interval centered on the Sun and the plus symbol marks the location of the Galactic Center. The blue dashed circle marks the distance threshold used to split the target sample among the two ALMA antenna configurations designed to provide a minimum 1000 au linear resolution. The red circle marks the 7.5 kpc distance originally used as an upper limit for source selection. Right panel: Lbol/Mclump plot for the 1017 selected clumps (color-coded by Tdust) is shown on the right. Asterisks indicate Hi-GAL sample sources associated with H II regions from the surveys of CORNISH (Purcell et al. 2013), and CORNISH-S (Irabor et al. 2023).
Current usage metrics show cumulative count of Article Views (full-text article views including HTML views, PDF and ePub downloads, according to the available data) and Abstracts Views on Vision4Press platform.
Data correspond to usage on the plateform after 2015. The current usage metrics is available 48-96 hours after online publication and is updated daily on week days.
Initial download of the metrics may take a while.