Fig. 18
Download original image
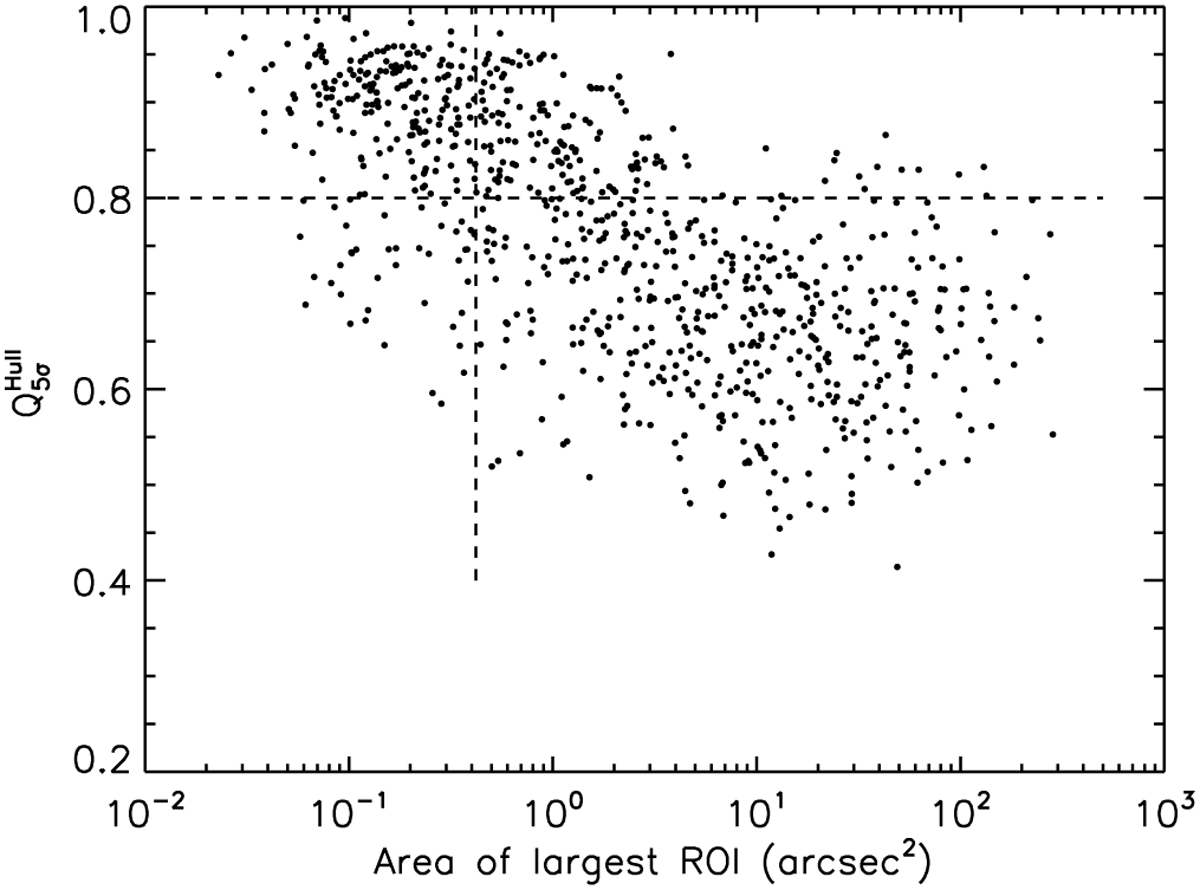
Distribution of the ![]() parameter as a function of the area of emission above 5σ. The horizontal dashed line marks the
parameter as a function of the area of emission above 5σ. The horizontal dashed line marks the ![]() threshold identified in Fig. 15 to distinguish roughly circular areas of emission from more complex morphologies. The vertical dashed line indicates the maximum area of the beam for all fields, showing that a significant fraction of approximately circular emission areas (above the horizontal line) have areas much larger than the beam.
threshold identified in Fig. 15 to distinguish roughly circular areas of emission from more complex morphologies. The vertical dashed line indicates the maximum area of the beam for all fields, showing that a significant fraction of approximately circular emission areas (above the horizontal line) have areas much larger than the beam.
Current usage metrics show cumulative count of Article Views (full-text article views including HTML views, PDF and ePub downloads, according to the available data) and Abstracts Views on Vision4Press platform.
Data correspond to usage on the plateform after 2015. The current usage metrics is available 48-96 hours after online publication and is updated daily on week days.
Initial download of the metrics may take a while.