Fig. 14
Download original image
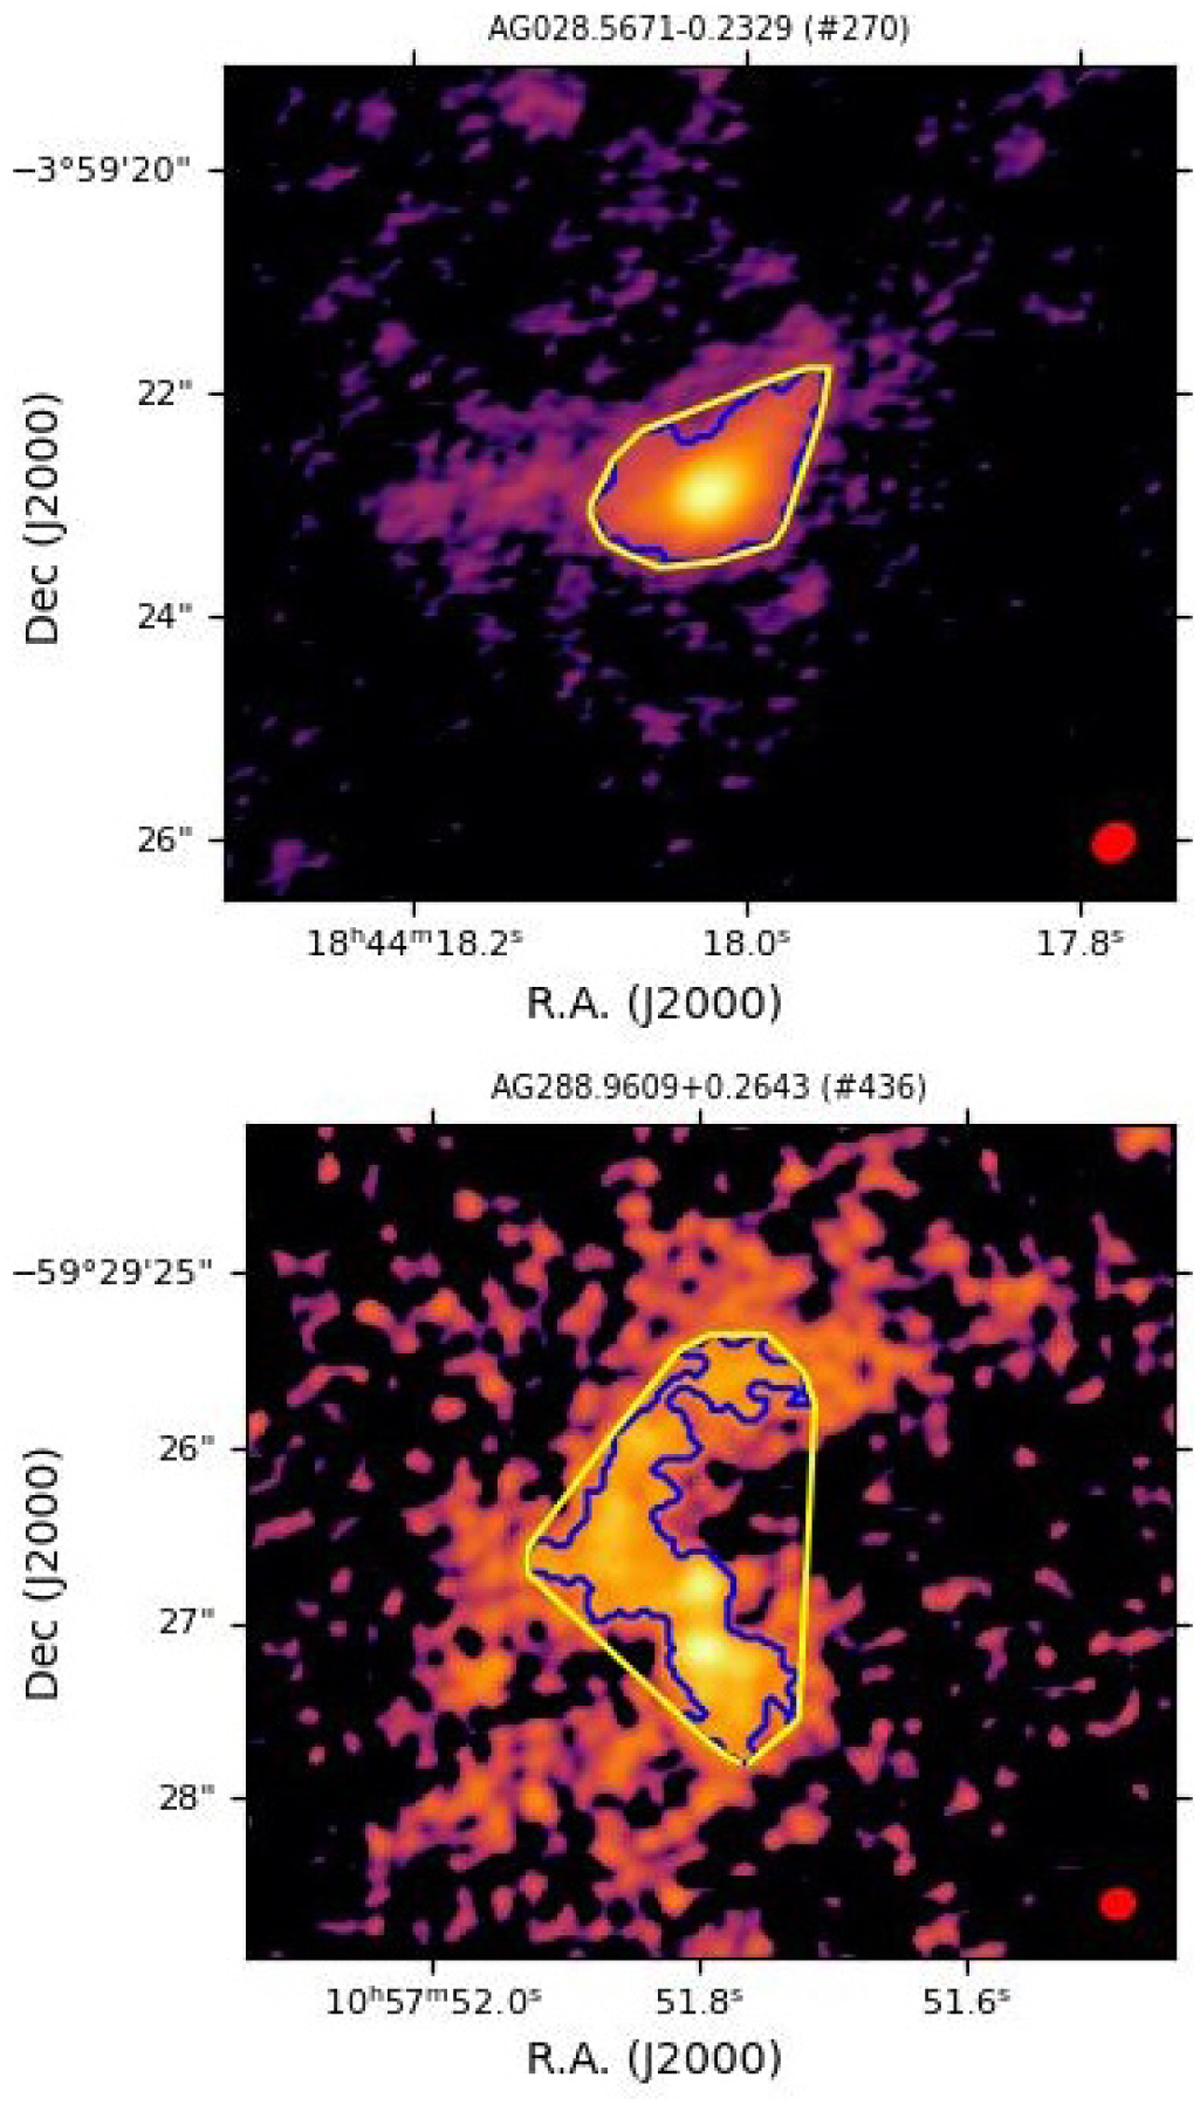
Two ALMAGAL fields showing different morphologies for similar 5σ emission areas. The blue contours in each field correspond to the 5σ noise level, while the yellow polygons represent the computed convex hull for the largest RoI in the fields. We have ![]() is ∼0.85 for the field in the top map, and ∼0.5 for the field in the bottom map. In both plots, the red ellipse in the bottom-right corner is the beam. Source AG name and running number as in Table 1.
is ∼0.85 for the field in the top map, and ∼0.5 for the field in the bottom map. In both plots, the red ellipse in the bottom-right corner is the beam. Source AG name and running number as in Table 1.
Current usage metrics show cumulative count of Article Views (full-text article views including HTML views, PDF and ePub downloads, according to the available data) and Abstracts Views on Vision4Press platform.
Data correspond to usage on the plateform after 2015. The current usage metrics is available 48-96 hours after online publication and is updated daily on week days.
Initial download of the metrics may take a while.