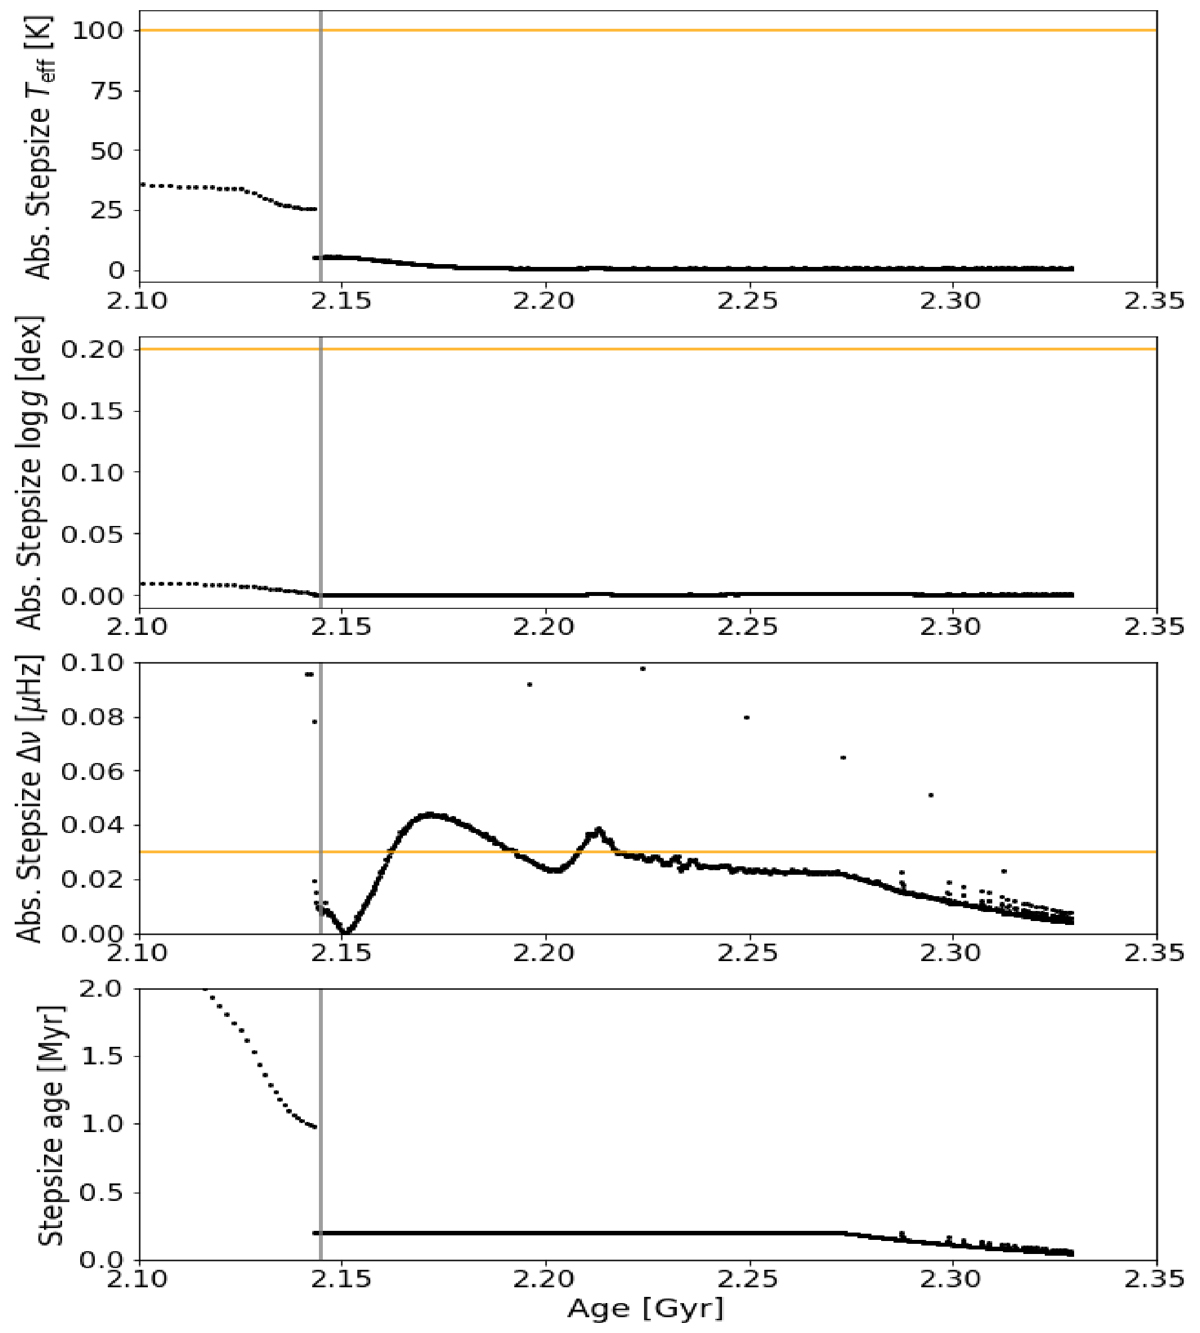
Fig. B.1.
Download original image
Variation of the parameters used in the figure of merit between consecutive time steps of a model for a star with 1.39 M⊙ and Z = 0.007. The top, middle, and bottom panels show the differential evolution of the effective temperature Teff, surface gravity logg and Δν, respectively. The vertical gray line indicates when a maximum timestep of 0.2 Myr was enforced between two models. The horizontal orange lines indicate the respective observational uncertainties for the given parameters. The bottom panel gives the timestep between consecutive models as a function of age.
Current usage metrics show cumulative count of Article Views (full-text article views including HTML views, PDF and ePub downloads, according to the available data) and Abstracts Views on Vision4Press platform.
Data correspond to usage on the plateform after 2015. The current usage metrics is available 48-96 hours after online publication and is updated daily on week days.
Initial download of the metrics may take a while.