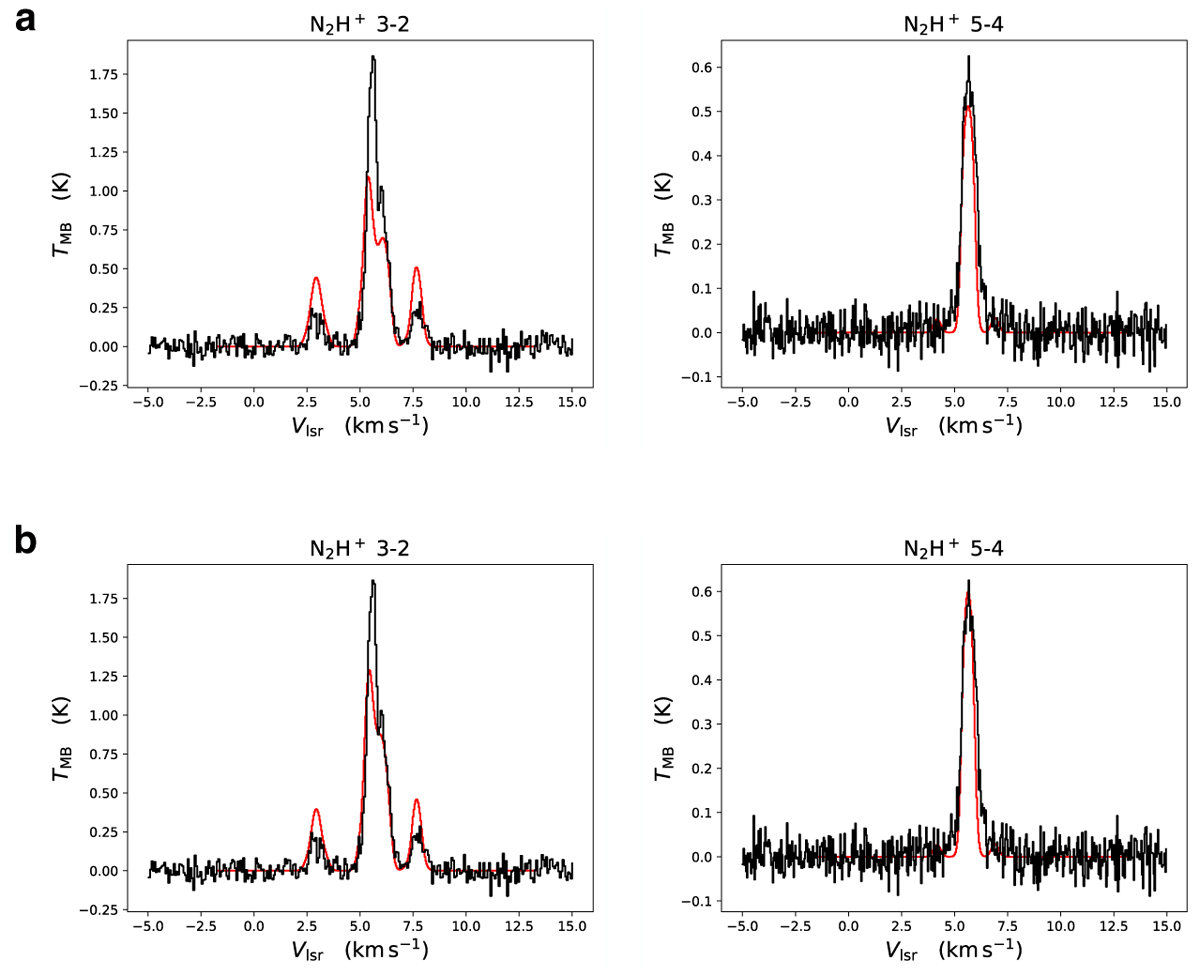
Fig. E.1
Download original image
LOC tests with lower volume density. Panel (a): we scaled down the volume density profile used for the results shown in Fig. 1 by a factor of 10 and scaled up the abundance profile of N2H+ by a factor of 45 in the effort of reproducing the observed lines. Panel (b): we reduced the volume density profile used in Fig. 1 by a factor of 5 and scaled up the abundance profile of N2H+ by a factor of 15. In both cases, we show that it is not possible to reproduce both transitions with a lower volume density by only increasing the abundance of N2H+.
Current usage metrics show cumulative count of Article Views (full-text article views including HTML views, PDF and ePub downloads, according to the available data) and Abstracts Views on Vision4Press platform.
Data correspond to usage on the plateform after 2015. The current usage metrics is available 48-96 hours after online publication and is updated daily on week days.
Initial download of the metrics may take a while.