Open Access
Fig. C.1
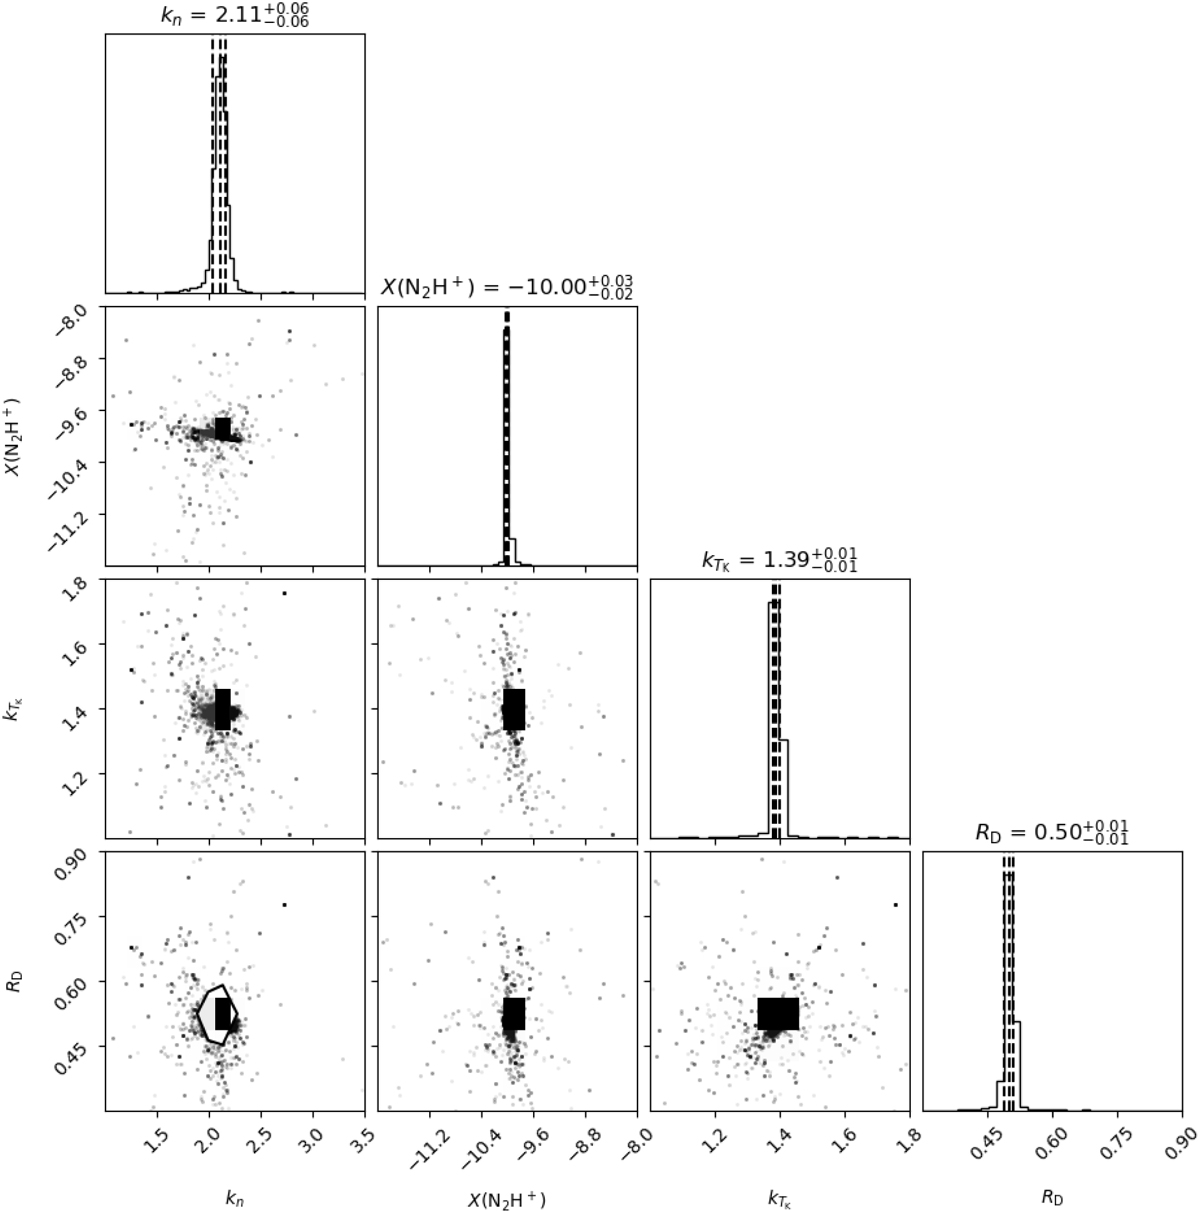
Download original image
Corner plots of the MCMC+LOC modelling of the five N2H+ and N2D+ lines towards the target. The title of each corner reports the 50th percentile (median), together with the 16th and 84th percentiles as negative and positive uncertainties, respectively.
Current usage metrics show cumulative count of Article Views (full-text article views including HTML views, PDF and ePub downloads, according to the available data) and Abstracts Views on Vision4Press platform.
Data correspond to usage on the plateform after 2015. The current usage metrics is available 48-96 hours after online publication and is updated daily on week days.
Initial download of the metrics may take a while.