Open Access
Fig. B.1
Download original image
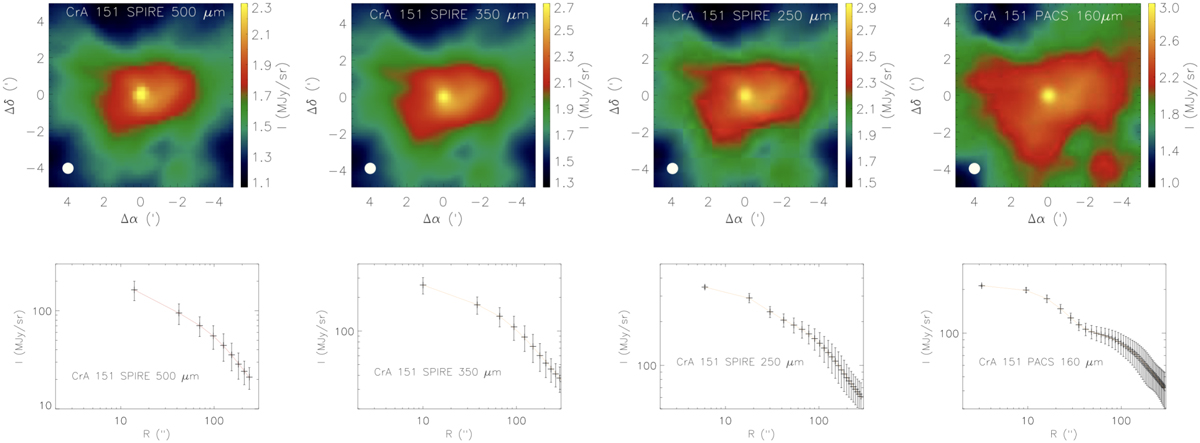
Top row: Herschel SPIRE and PACS maps. Bottom row: Corresponding circularly averaged intensity profiles. One can note the broader emission at large radii in the 160 and 250 μm maps that require two Plummer profiles for an optimal fit. The 160, 250, and 350 μm maps have been smoothed to the resolution of the 500 μm one.
Current usage metrics show cumulative count of Article Views (full-text article views including HTML views, PDF and ePub downloads, according to the available data) and Abstracts Views on Vision4Press platform.
Data correspond to usage on the plateform after 2015. The current usage metrics is available 48-96 hours after online publication and is updated daily on week days.
Initial download of the metrics may take a while.