Open Access
Fig. A.1
Download original image
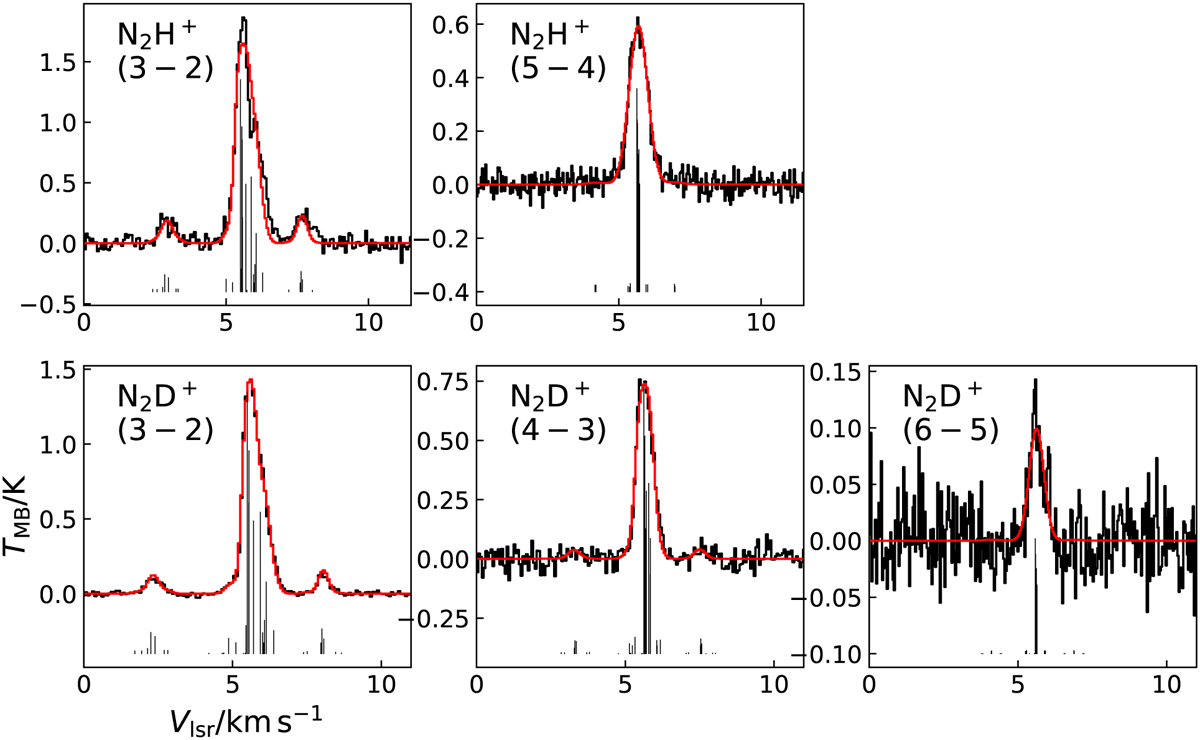
N2H+ and N2D+ spectra (black histograms) and the best-fit solution found by CLASS (red histograms), assuming the same excitation temperature for all the hyperfine components. The vertical black lines show the position of the hyperfine components; their length is proportional to the relative intensities.
Current usage metrics show cumulative count of Article Views (full-text article views including HTML views, PDF and ePub downloads, according to the available data) and Abstracts Views on Vision4Press platform.
Data correspond to usage on the plateform after 2015. The current usage metrics is available 48-96 hours after online publication and is updated daily on week days.
Initial download of the metrics may take a while.