Fig. 5
Download original image
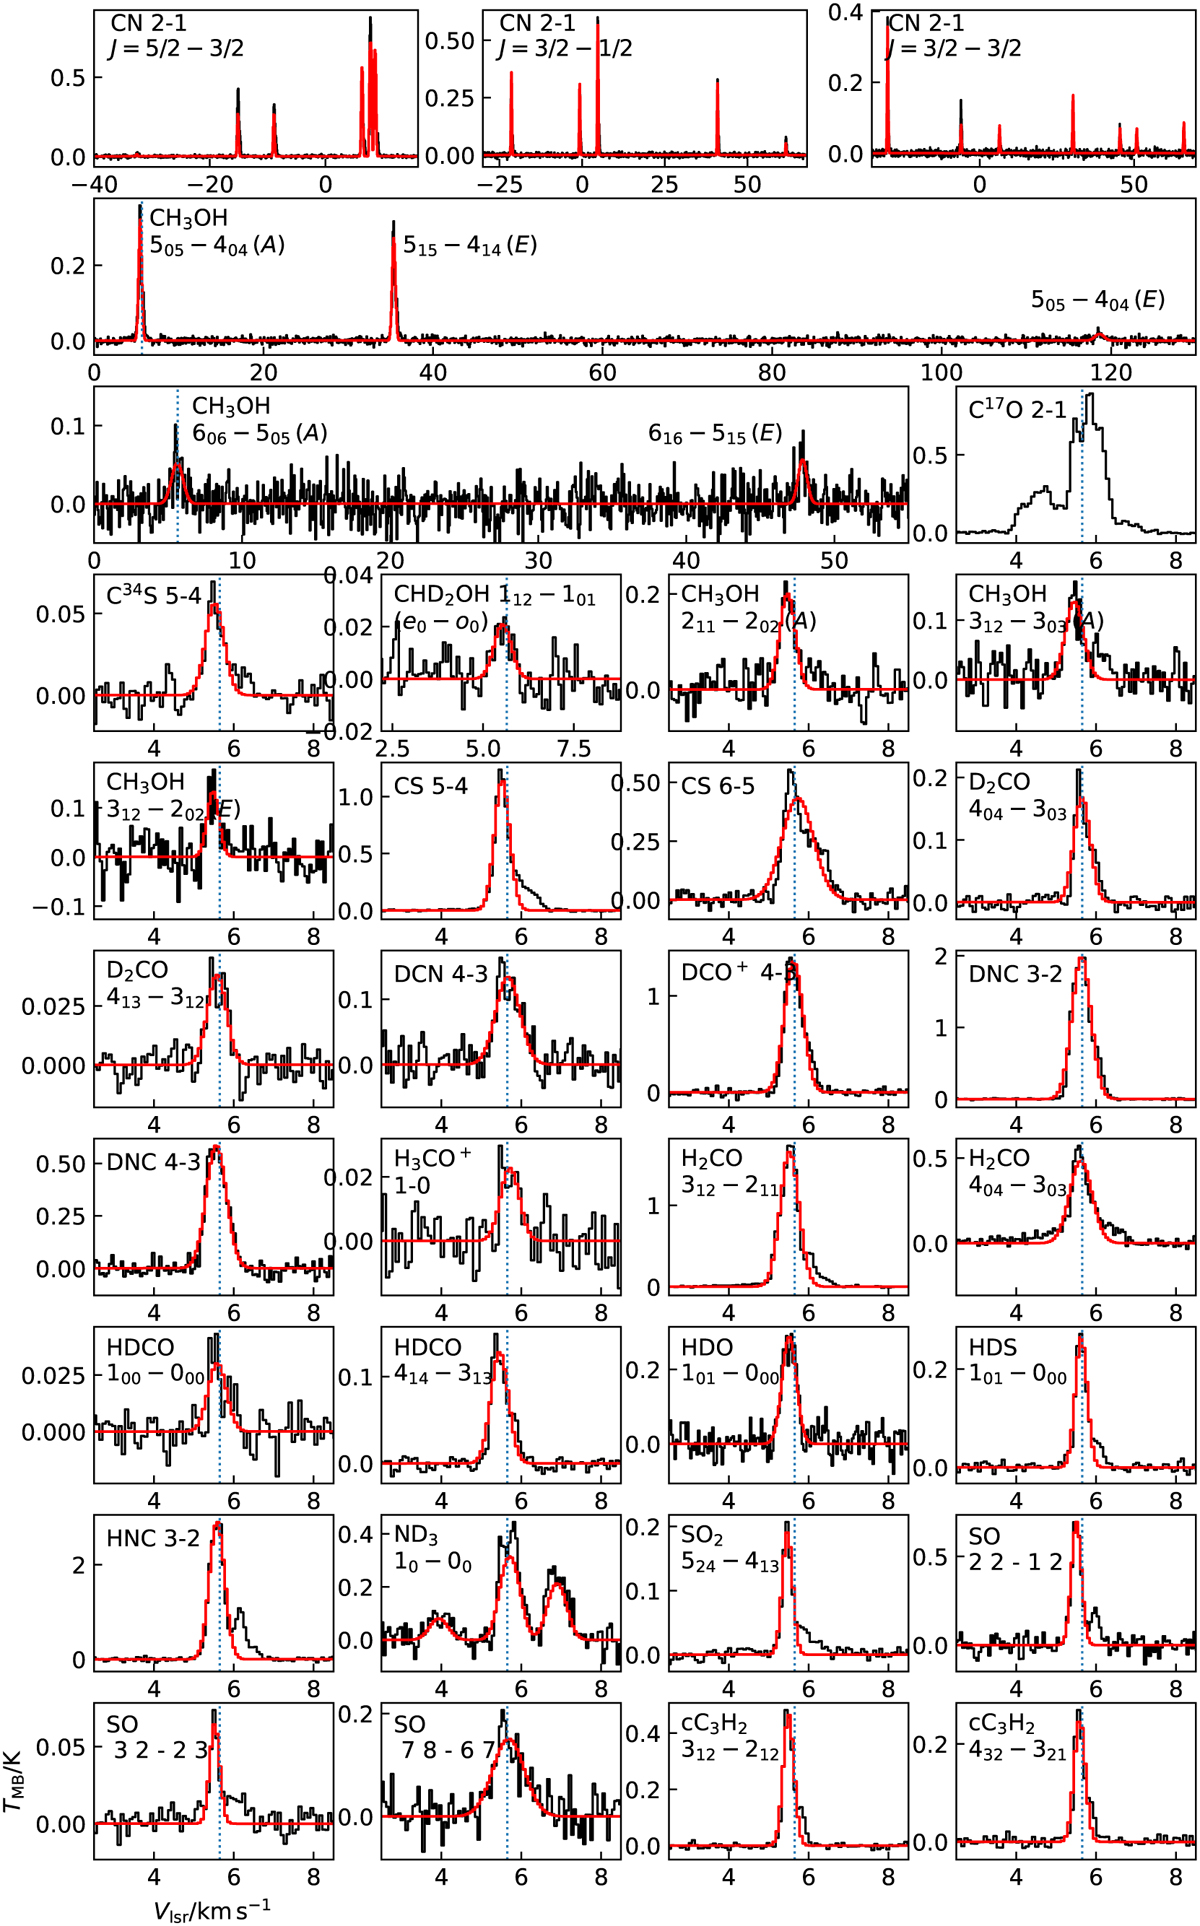
Observed spectra of the species identified in the frequency coverage of the N2H+−N2D+ data (black histograms). The transitions are labelled in the top-left corner of each panel. The red histograms show the spectral fit performed with CLASS, which is a Gaussian fit for all transitions except for the ND3 and CN ones, for which we fit the hyperfine structure using the HFS routine. The vertical dotted line in each panel shows the source Vlsr = 5.65 km s−1, corresponding to the weighted average measured in the N2H+ and N2D+ lines.
Current usage metrics show cumulative count of Article Views (full-text article views including HTML views, PDF and ePub downloads, according to the available data) and Abstracts Views on Vision4Press platform.
Data correspond to usage on the plateform after 2015. The current usage metrics is available 48-96 hours after online publication and is updated daily on week days.
Initial download of the metrics may take a while.