Fig. 3
Download original image
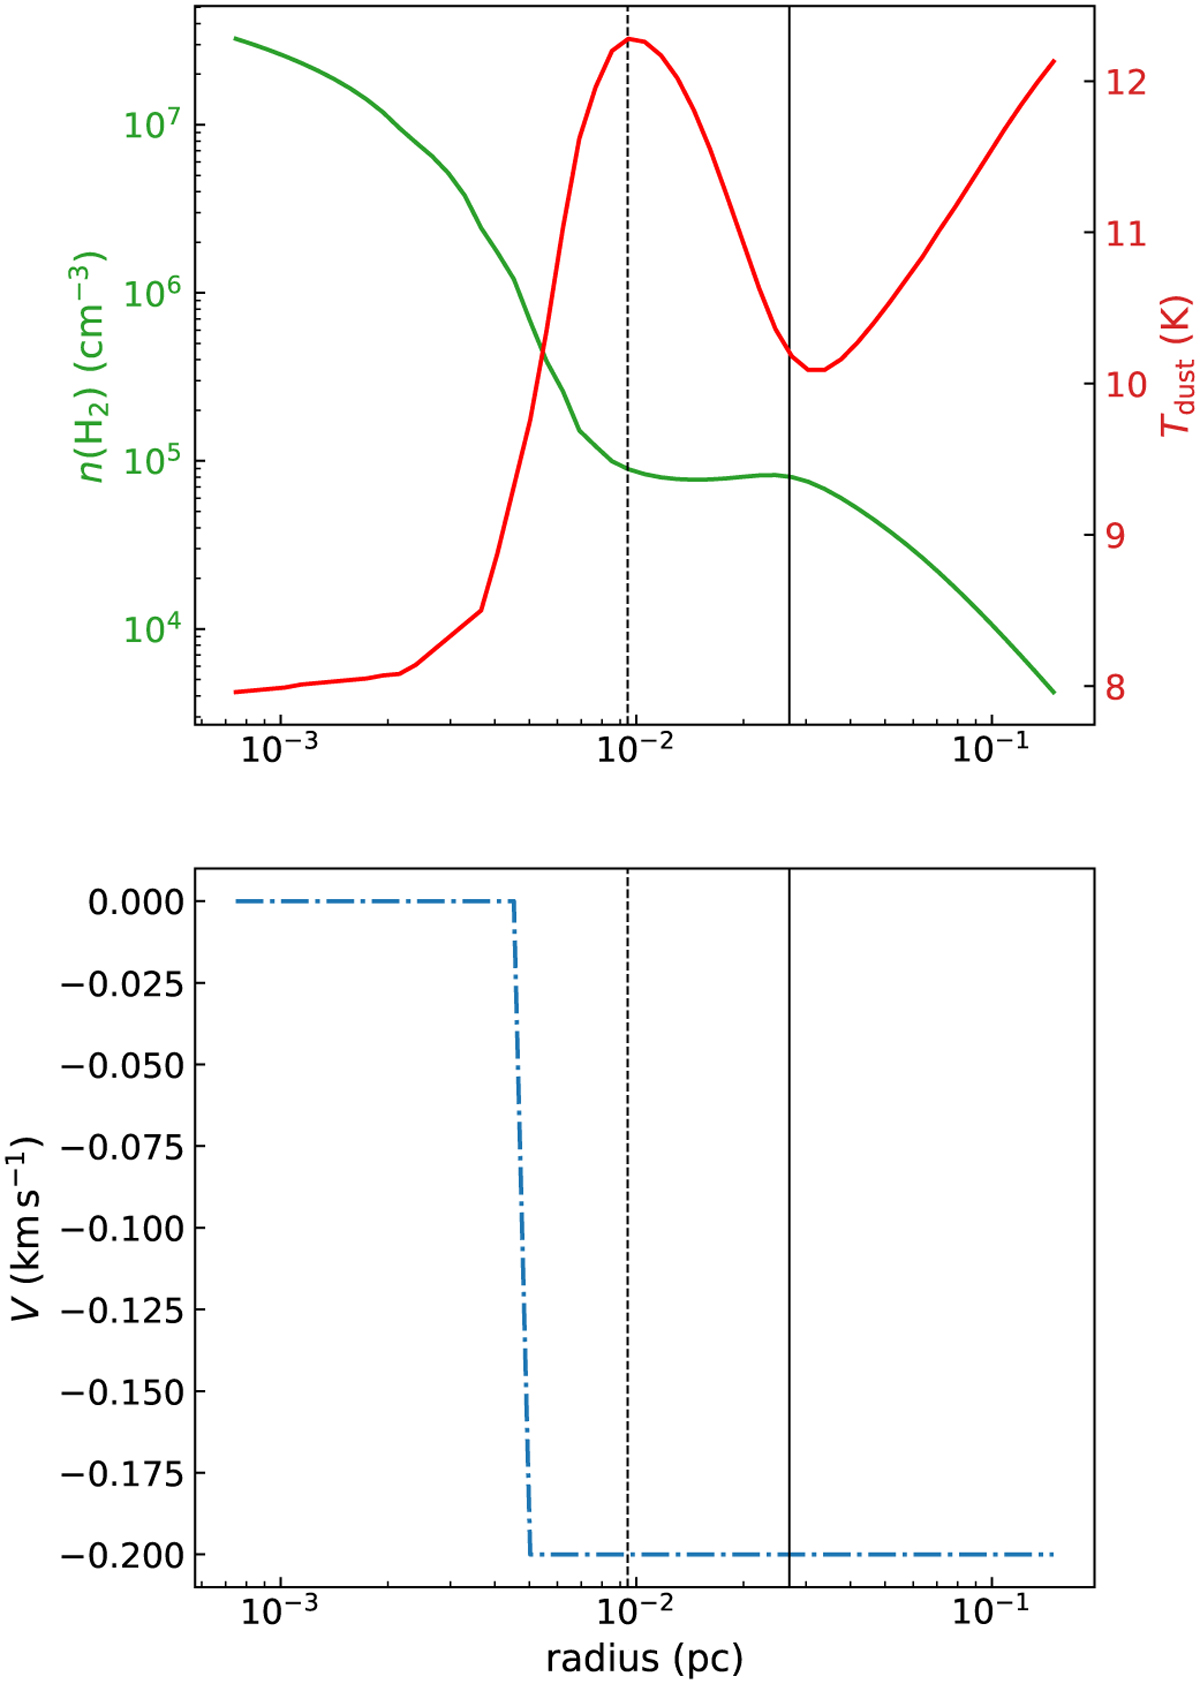
Top panel: physical model of CrA 151 obtained from the Herschel data. The green curve (left y-axis) shows the total volume density n(H2), whilst the red curve (right y-axis) shows the dust temperature. The bumps in both profiles are due to a double Plummer-like structure. Bottom panel: velocity profile used for the MCMC modelling. In both panels, the vertical dashed and solid lines show the minimum and maximum resolution of the observations, from 13′′(N2H+ 5 − 4) to 37′′ (Herschel data).
Current usage metrics show cumulative count of Article Views (full-text article views including HTML views, PDF and ePub downloads, according to the available data) and Abstracts Views on Vision4Press platform.
Data correspond to usage on the plateform after 2015. The current usage metrics is available 48-96 hours after online publication and is updated daily on week days.
Initial download of the metrics may take a while.