Fig. 2
Download original image
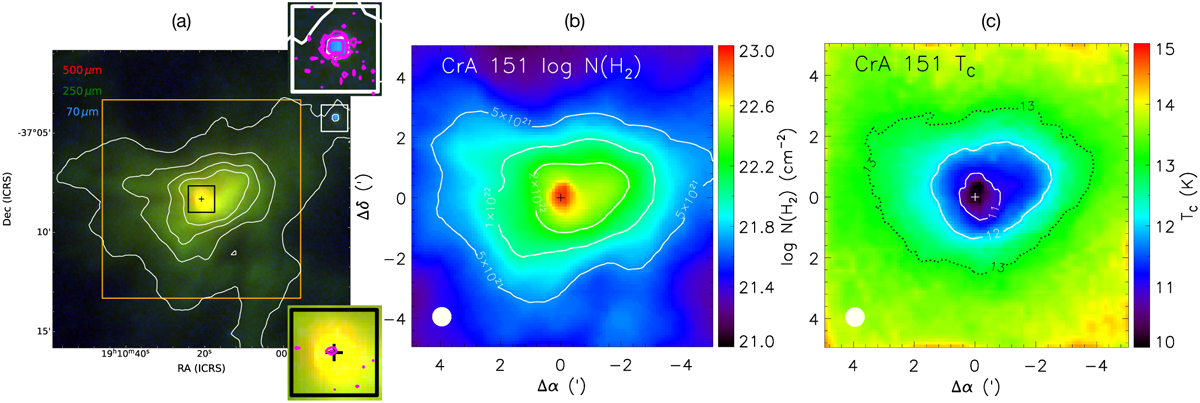
Panel a: three-colour RGB image of CrA 151 obtained using the Herschel data at 500 (red), 250 (green), and 70 μm (blue). The contours show the distribution of the 350 μm SPIRE flux. The two square subpanels show zoom-ins of the core’s centre (bottom-right subpanel) and of the area around the YSO in the north-west of the core (top-right subpanel), with the 70 μm Herschel emission in magenta contours (levels: [25, 50, 150] MJy/sr; 1σ = 15 MJy/sr). The orange rectangle shows the region presented in the next two panels. Panels b and c: zoom-in of the map of the N(H2) distribution and of the dust temperature (or colour temperature, TC) from the HGBS survey. The beam size is shown in the bottom-left corners. In all panels, the coordinates of the core’s centre are shown with the ‘+’ symbol.
Current usage metrics show cumulative count of Article Views (full-text article views including HTML views, PDF and ePub downloads, according to the available data) and Abstracts Views on Vision4Press platform.
Data correspond to usage on the plateform after 2015. The current usage metrics is available 48-96 hours after online publication and is updated daily on week days.
Initial download of the metrics may take a while.