Fig. 8.
Download original image
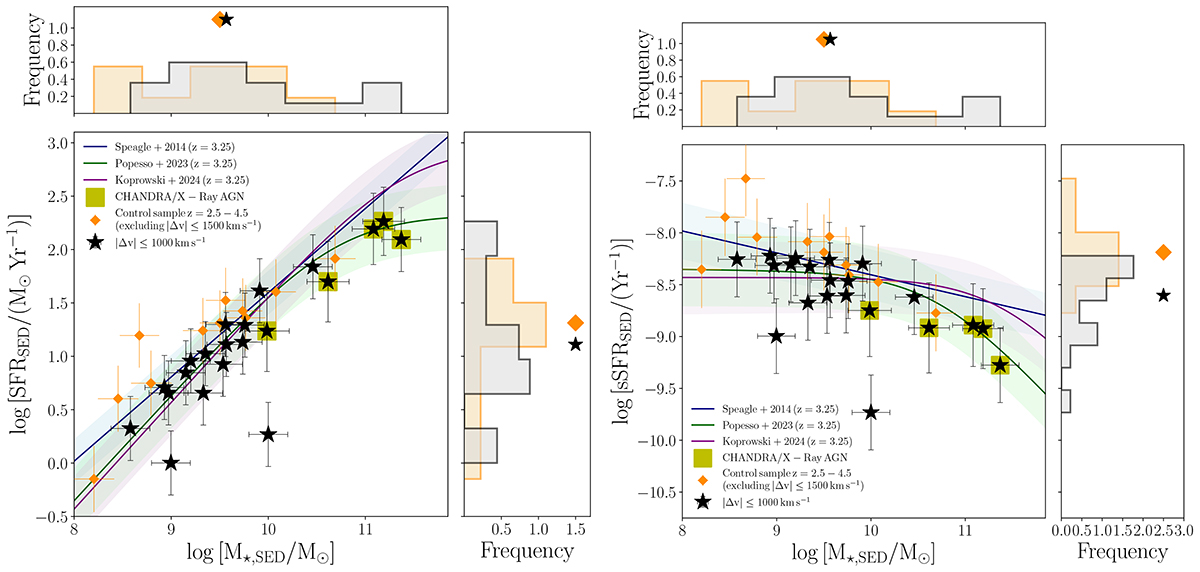
Star-forming main sequence, in terms of SFR (left panel) and sSFR (right panel), of the MQN01 galaxies clustered around the QSO (black stars), compared to the control-field sample (orange diamonds). The data are compared to the main sequence at z ≈ 3.25 derived from Speagle et al. (2014) (blue), Popesso et al. (2023) (green) and Koprowski et al. (2024) (purple). The X-Ray detected AGN are marked by yellow squares. The histograms on the top and right panels show the distribution of the SFR or sSFR and galaxies’ stellar mass, respectively, of the MQN01 galaxies (black) and of the control-field sample, together with their median values on top.
Current usage metrics show cumulative count of Article Views (full-text article views including HTML views, PDF and ePub downloads, according to the available data) and Abstracts Views on Vision4Press platform.
Data correspond to usage on the plateform after 2015. The current usage metrics is available 48-96 hours after online publication and is updated daily on week days.
Initial download of the metrics may take a while.