Fig. 7.
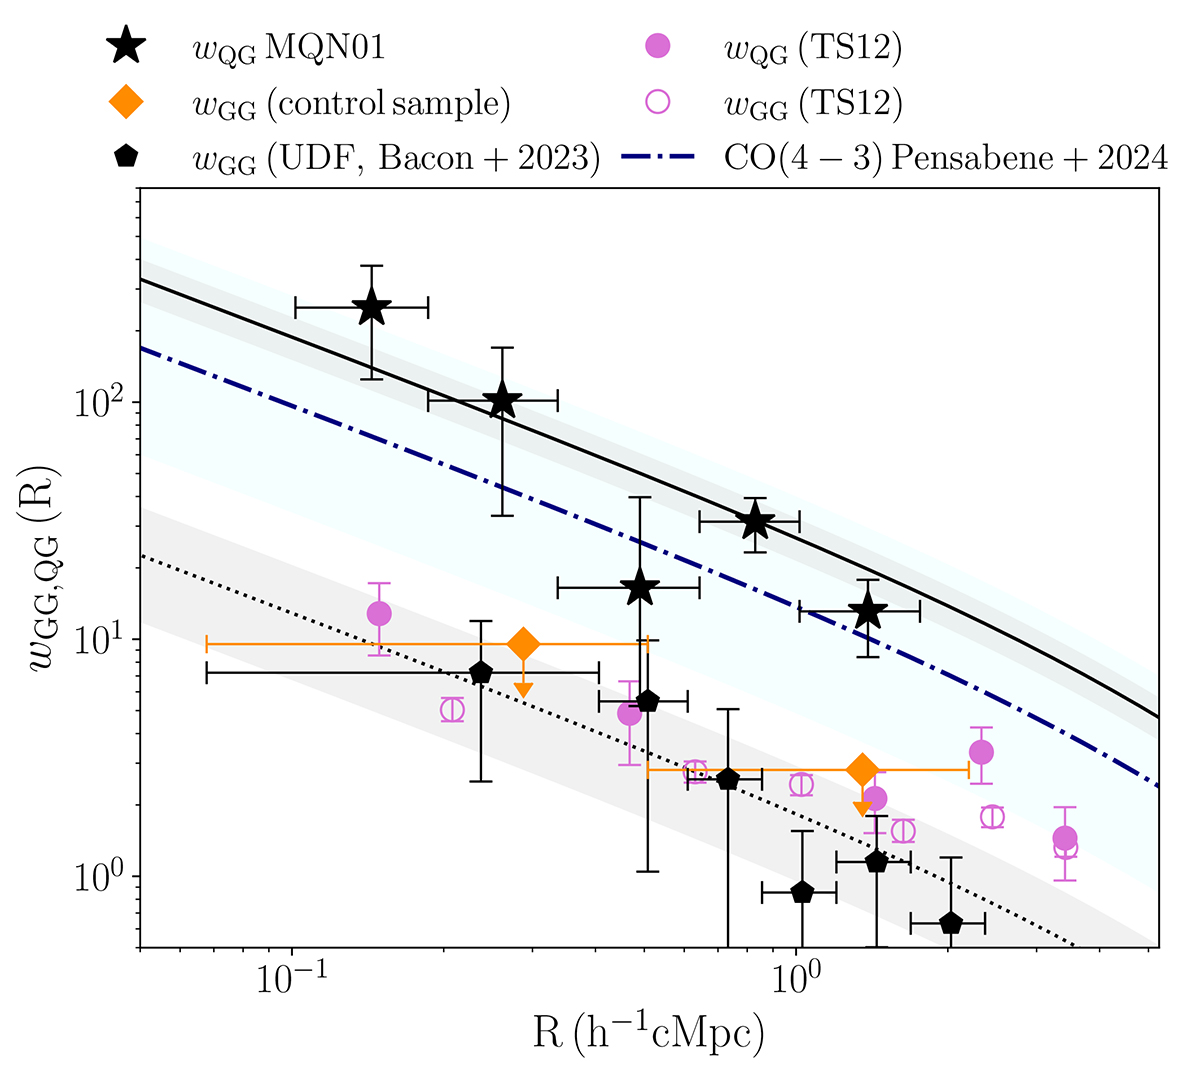
Download original image
Projected correlation functions assuming fixed γ = 1.8 and linking window |Δv|≤1000 km s−1. The QSO-galaxy cross-correlation function for the MUSE spectroscopic sample (black stars) is similar to that of CO(4–3) line emitters identified by Pensabene et al. (2024) in the same volume (blue line and shaded area), but significantly above that of Trainor & Steidel (2012) (purple, filled points). The galaxy-galaxy auto-correlation function is shown for the control-field sample of z = 2.5 − 4.5 galaxies identified in the UDF (black pentagons, Bacon et al. 2023), together with upper limits for the galaxies in our field within the same redshift range, but masking |Δv|≤1500 km s−1 around the redshift of the QSO (orange diamonds). Both the estimates are consistent with Trainor & Steidel (2012) (purple, empty points). The best-fit results are shown as dotted and solid lines for the auto and cross-correlation functions, respectively. All the uncertainties are derived from the 16th and 84th percentiles from bootstrap distributions.
Current usage metrics show cumulative count of Article Views (full-text article views including HTML views, PDF and ePub downloads, according to the available data) and Abstracts Views on Vision4Press platform.
Data correspond to usage on the plateform after 2015. The current usage metrics is available 48-96 hours after online publication and is updated daily on week days.
Initial download of the metrics may take a while.