Fig. 6.
Download original image
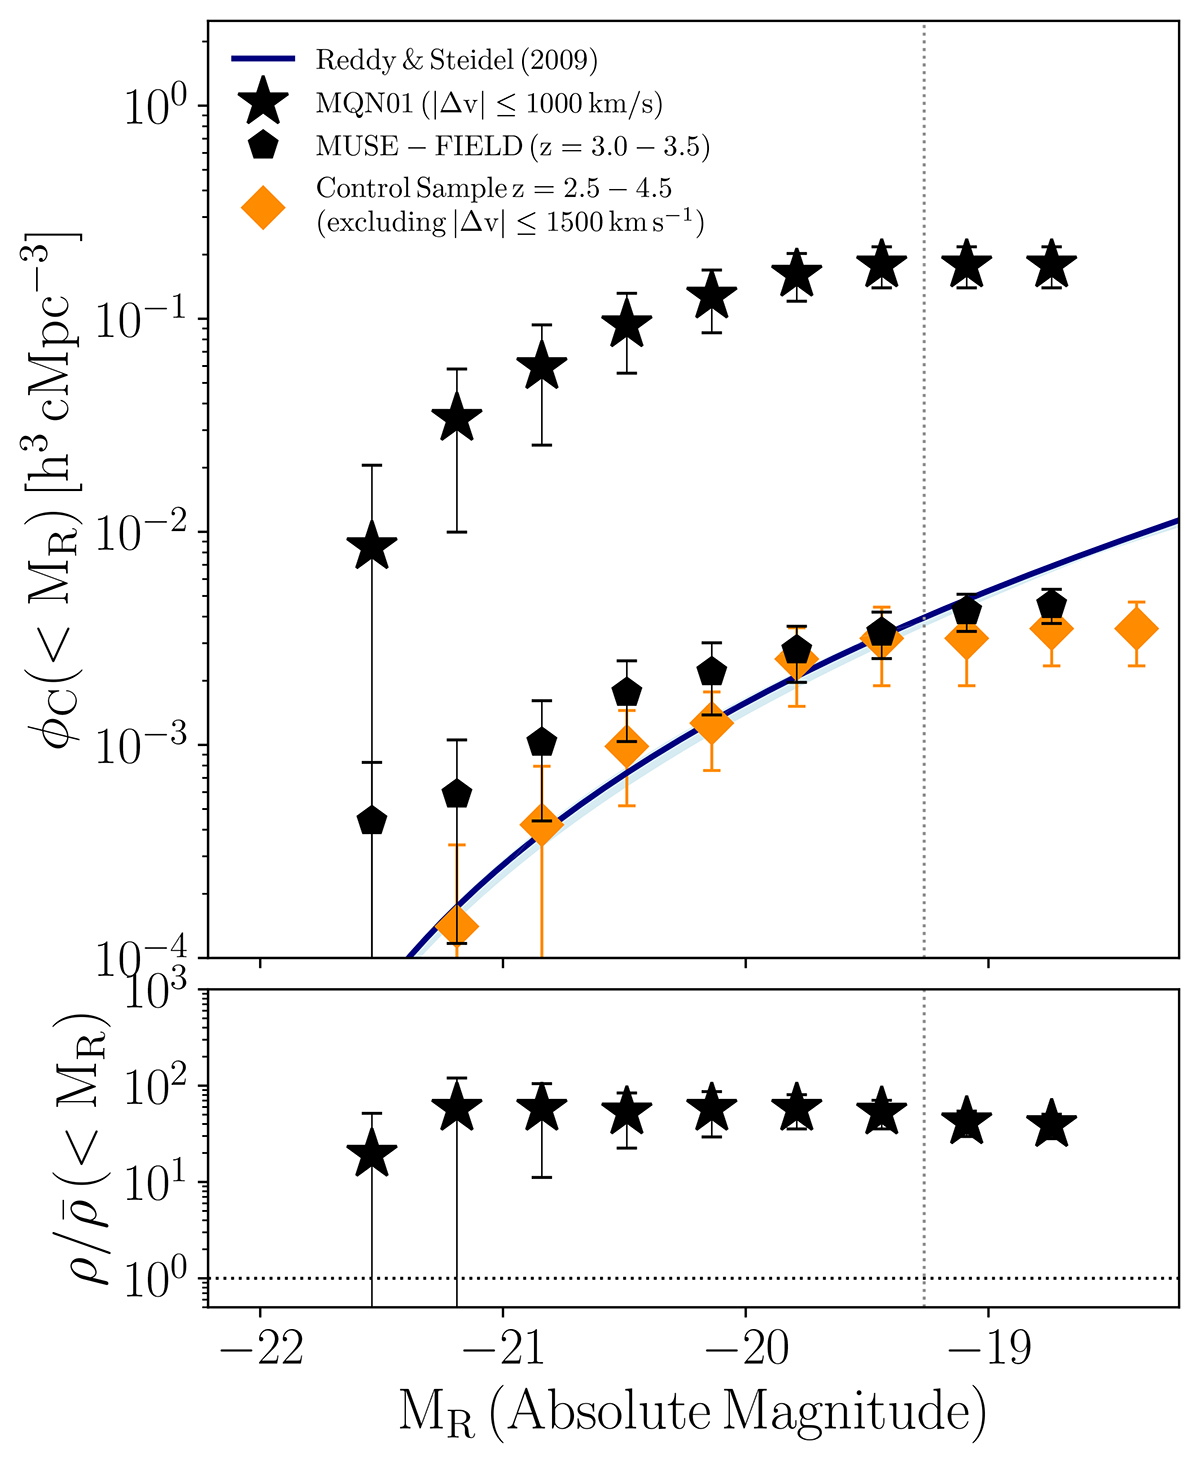
Luminosity functions and overdensity of galaxies identified around the central QSO. Upper panel: cumulative R-band luminosity function of the MQN01 galaxies found within |Δv|≤1000 km s−1 from the redshift of the QSO (black stars), compared to that of the “MUSE-FIELD” sample (black pentagons) and of the control sample of sources found in the MQN01 MUSE FoV within 2.5 < z < 4.5, masking |Δv|≤1500 km s−1 around the QSO (orange diamonds). The vertical dotted line shows the magnitude at which the luminosity function of the spectroscopic samples flattens relative to the completeness-corrected one from Reddy & Steidel (2009). Lower panel: overdensity as a function of the R-band magnitude.
Current usage metrics show cumulative count of Article Views (full-text article views including HTML views, PDF and ePub downloads, according to the available data) and Abstracts Views on Vision4Press platform.
Data correspond to usage on the plateform after 2015. The current usage metrics is available 48-96 hours after online publication and is updated daily on week days.
Initial download of the metrics may take a while.