Fig. 5.
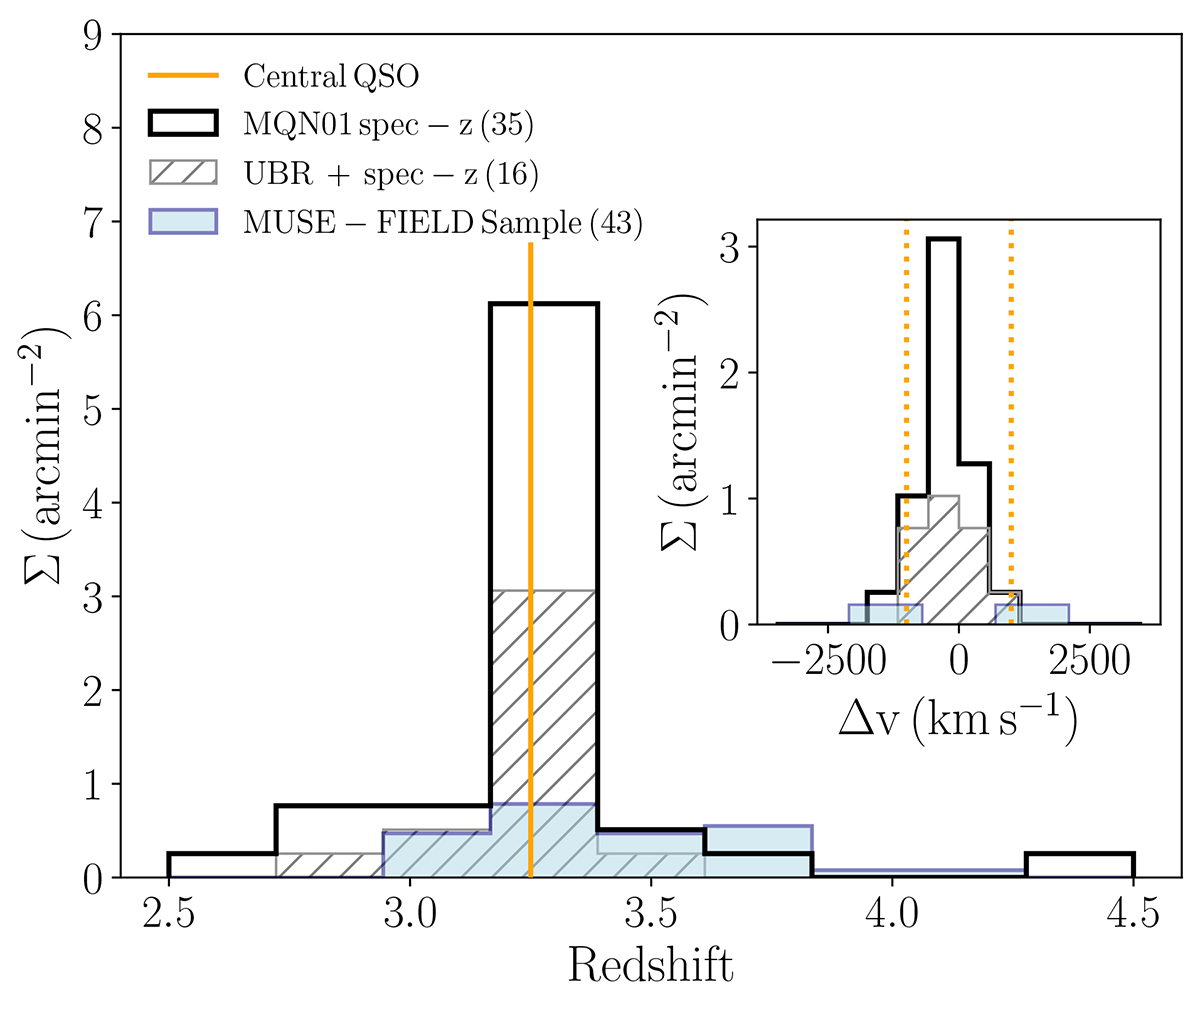
Download original image
Redshift distributions of the MQN01 high-confidence spectroscopic sample (black histogram) and of the UBR-selected LBGs with secure spectroscopic redshift from MUSE (hatched gray histogram). These are compared to the “MUSE-FIELD” sample and normalized by the surveyed area. The redshift of the central QSO is marked by an orange vertical line. The inset shows the velocity distribution of the MUSE galaxies and of the LBGs relative to the redshift of the QSO. The line-of-sight velocity window corresponding to |Δv|≤1000 km s−1 is highlighted by dotted vertical lines.
Current usage metrics show cumulative count of Article Views (full-text article views including HTML views, PDF and ePub downloads, according to the available data) and Abstracts Views on Vision4Press platform.
Data correspond to usage on the plateform after 2015. The current usage metrics is available 48-96 hours after online publication and is updated daily on week days.
Initial download of the metrics may take a while.