Fig. 4.
Download original image
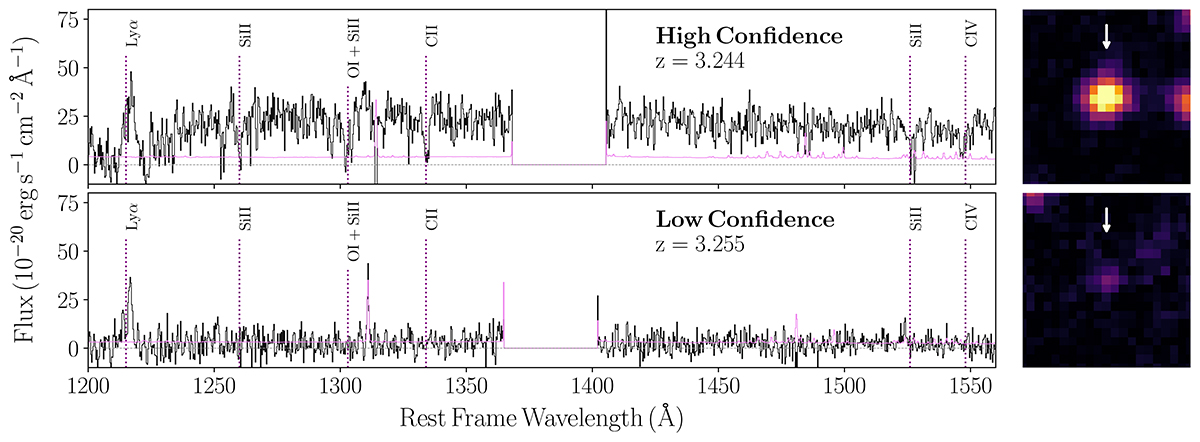
Examples of source classification based on the quality of spectroscopic redshift constraints in MUSE. Left panels: spectra (black) and errors (violet) extracted from MUSE datacubes up to the rest-frame wavelength of the C IV transition (corresponding to observed 6580 Å at z = 3.25), with major spectral features highlighted by vertical dotted lines, as discussed in Section 2.1. When these features are clearly visible, the source is assigned a high-confidence redshift (upper panel). In contrast, when only the Lyα emission line is detected, the redshift measurement is considered low confidence (lower panel). Right panels: 2″ × 2″ cutouts of the MUSE white-light image used for source detection, with the sources indicated by white arrows.
Current usage metrics show cumulative count of Article Views (full-text article views including HTML views, PDF and ePub downloads, according to the available data) and Abstracts Views on Vision4Press platform.
Data correspond to usage on the plateform after 2015. The current usage metrics is available 48-96 hours after online publication and is updated daily on week days.
Initial download of the metrics may take a while.