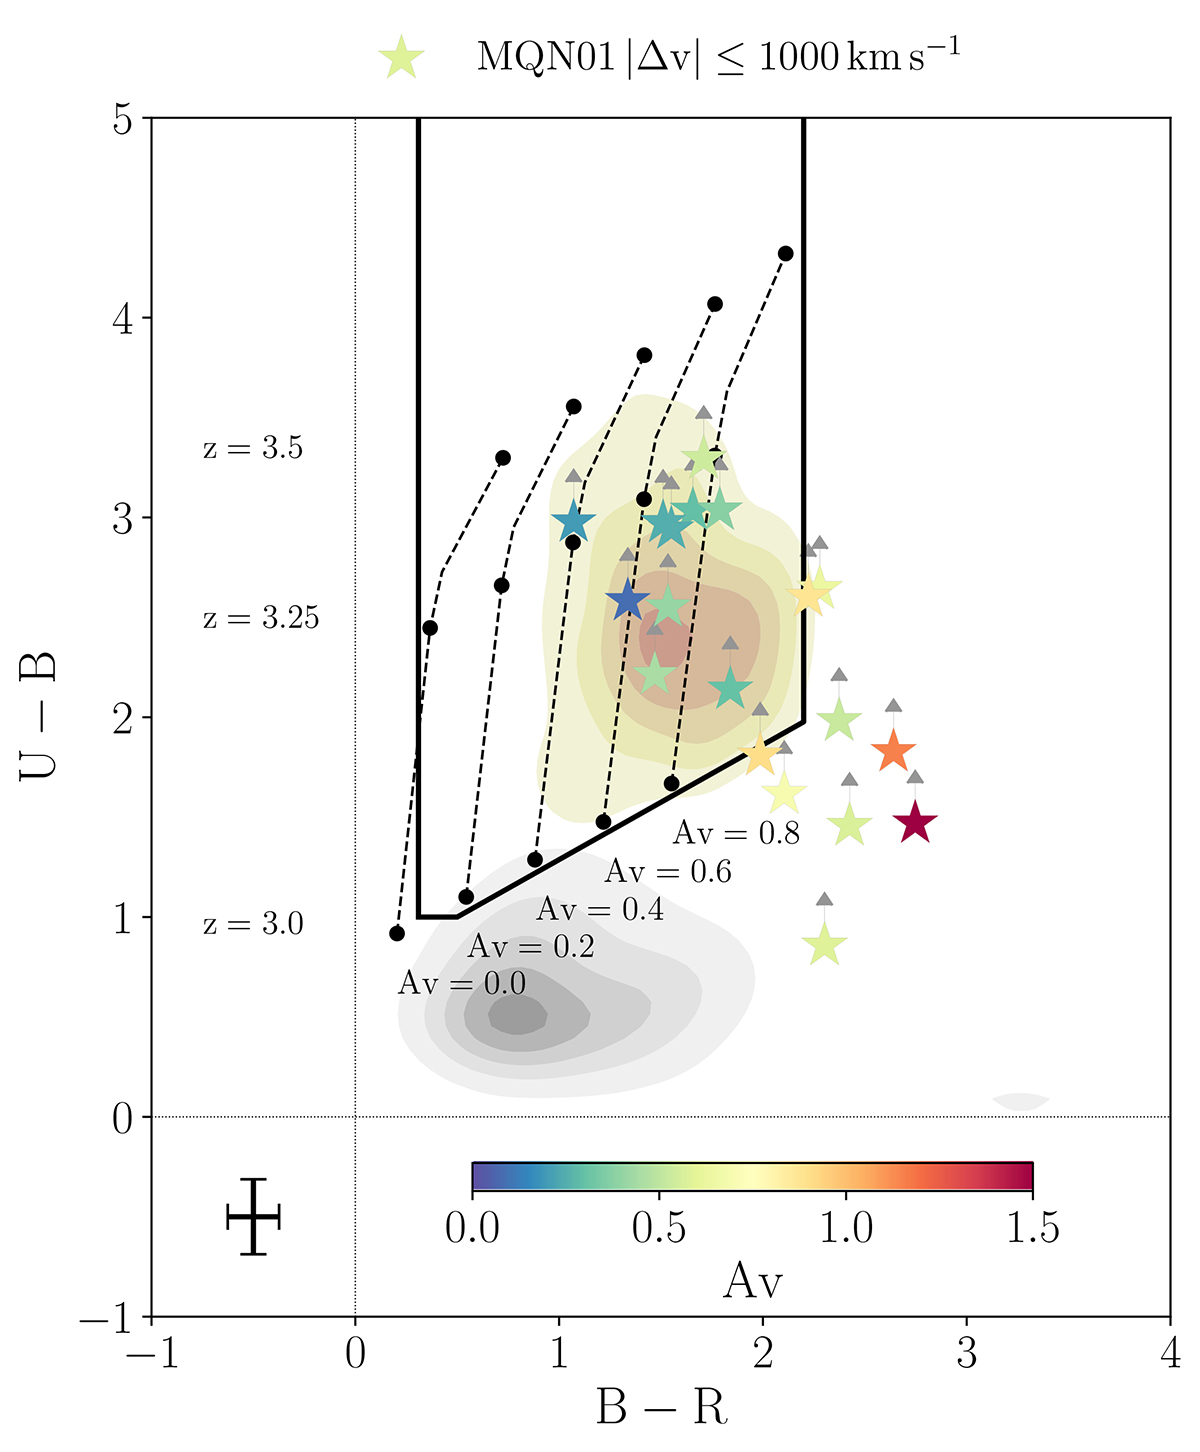
Fig. 3.
Download original image
UBR color selection of LBGs. The selection region (delimited by solid black lines) is calibrated based on the redshift tracks of typical LBG templates (dashed lines). The orange density contours show the LBGs candidates at z ≈ 3.0 − 3.5 that are selected by our criterion. The sources with spectroscopic redshift from MUSE and found within |Δv|≤1000 km s−1 from the central QSO are shown as stars and are color-coded by their visual extinction, Av, estimated by fitting their SEDs (see Section 3.4). The gray density contours mark all the R-band detection within the FORS2 FoV. Typical errors on the colors are shown in the lower-left corner.
Current usage metrics show cumulative count of Article Views (full-text article views including HTML views, PDF and ePub downloads, according to the available data) and Abstracts Views on Vision4Press platform.
Data correspond to usage on the plateform after 2015. The current usage metrics is available 48-96 hours after online publication and is updated daily on week days.
Initial download of the metrics may take a while.