Fig. 2.
Download original image
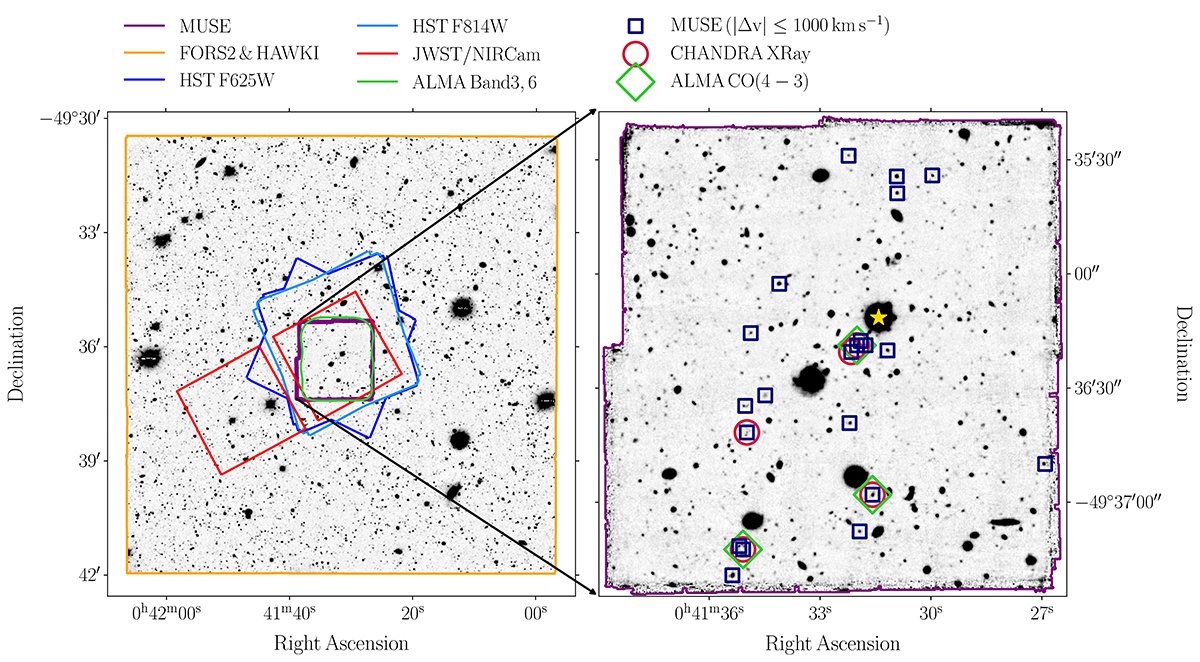
Visualization of the multiwavelength data explored in this work. Left panel: FORS2/R-band image with overlaid the footprint of the MUSE (purple), FORS2 and HAWK-I (orange), HST/ACS F625W (blue), HST/ACS F814W (light-blue), JWST/NIRCam (red) and ALMA/Band3 and Band6 (green) observations. Right panel: the zoom-in shows the MUSE White-Light image in the background with highlighted the MQN01 high-confidence sample of galaxies found in the MUSE FoV within a line-of-sight separation |Δv|≤1000 km s−1 around the QSO (blue squares), the cross-matched CO(4–3) line-emitters found by ALMA (green diamonds, see Pensabene et al. 2024) and X-Ray sources detected by Chandra (red circles, see Travascio et al. 2025). The target QSO is marked by a gold star.
Current usage metrics show cumulative count of Article Views (full-text article views including HTML views, PDF and ePub downloads, according to the available data) and Abstracts Views on Vision4Press platform.
Data correspond to usage on the plateform after 2015. The current usage metrics is available 48-96 hours after online publication and is updated daily on week days.
Initial download of the metrics may take a while.